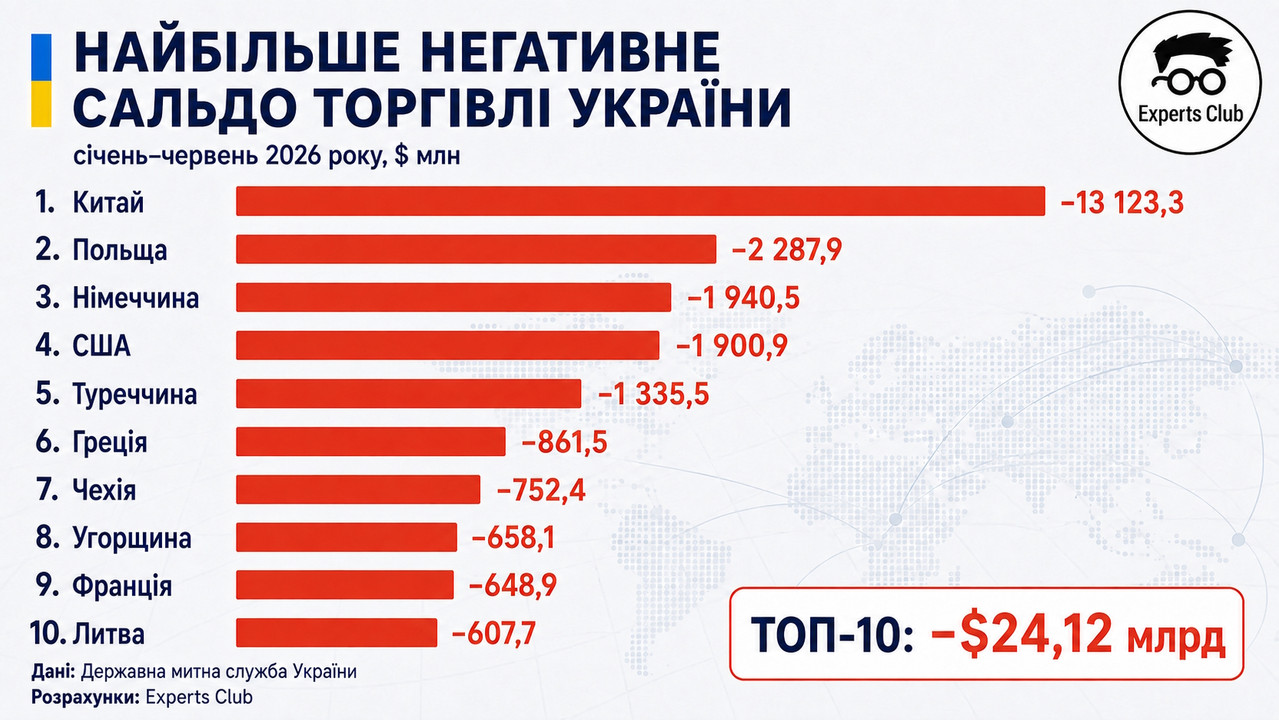
According to the results of January-June 2026, Ukraine had a negative balance of trade in goods with 37 of the 50 largest trading partners, according to the calculations of the Experts Club information and analytical center based on foreign trade data.
Total trade turnover with the top fifty countries amounted to $66.97 billion. Imports reached $47.35 billion, exports - $19.62 billion, and the total negative balance is $27.73 billion.
The sum of deficits in trade with 37 countries for which imports exceeded exports amounted to $30.72 billion. The positive balance with the remaining 13 partners in the amount of $2.99 billion partially compensated for this gap.
For comparison, according to official data of the State Customs Service, the total turnover of Ukraine in the first half of the year was $70.3 billion: imports — $49.3 billion, exports — $21 billion. So, the TOP-50 partners accounted for more than 95% of foreign trade in goods.
The ten largest deficit areas provided $41.78 billion in turnover. Ukraine imported $32.95 billion worth of goods from these countries, and exported only $8.83 billion. The negative balance was $24.12 billion — about 87% of the net trade deficit with TOP-50 partners.
The ratio of import to export coverage in this group was 26.8%. In other words, for every dollar of Ukrainian exports, there were approximately $3.73 of imports.
Ten largest trade deficit areas of Ukraine in the first half of 2026
Place | Country | Imports, $ billion | Exports, $ billion | Balance, $ billion | Coverage of imports by exports |
1 | China | 13.90 | 0.78 | –13.12 | 5.6% |
2 | Poland | 4.67 | 2.38 | –2.29 | 51.0% |
3 | Germany | 3.21 | 1.27 | –1.94 | 39.5% |
4 | USA | 2.49 | 0.59 | –1.90 | 23.6% |
5 | Turkey | 3.12 | 1.78 | –1.34 | 57.1% |
6 | Greece | 1.05 | 0.19 | –0.86 | 17.8% |
7 | Czech Republic | 1.26 | 0.51 | –0.75 | 40.3% |
8 | Hungary | 1.28 | 0.62 | colspan="1" rowspan="1" colwidth="186" style="text-align: left;">France
1.02 | 0.37 | –0.65 | 36.3% |
10 | Lithuania | 0.96 | 0.35 | –0.61 | 36.7% |
The first five countries — China, Poland, Germany, the USA and Turkey — created a deficit of $20.59 billion. This is 74.3% of the net negative trade balance with the TOP-50 partners.
China took first place by a significant margin. The import of Chinese products was $13.9 billion, the export of Ukrainian goods was only $778.4 million. The negative balance reached $13.12 billion, or 47.3% of the total trade deficit with the TOP-50.
Exports covered only 5.6% of imports. Thus, the volume of Chinese supplies to Ukraine was almost 18 times greater than the return flow of goods.
According to the open product breakdown of the State Customs Service, the leading items of Chinese imports were electric batteries - $1.62 billion, transmission, television and video equipment — $1.11 billion, fiber-optic products — $770.5 million, transformers and chokes — $720.8 million, unmanned aerial vehicles — $684.4 million.
Significant volumes also fell on telephone and telecommunication equipment — $620.8 million, electric motors and generators — $589.8 million, computer equipment — $363.7 million and semiconductor devices - $347.8 million.
So, the Chinese deficit is formed not by one category, but by a wide range of technological, energy, electronic and consumer products.
Poland took second place in terms of the size of the negative balance - $2.29 billion. At the same time, the Polish direction was much more balanced than the Chinese one: Ukrainian exports covered 51% imports, while Poland remained the largest single market for Ukrainian products.
The largest publicized position of imports of Polish origin was oil and petroleum products — $904.6 million. It was followed by petroleum gases — $205.6 million, aircraft parts — $192 million, unmanned aerial vehicles — $133.9 million, complex fertilizers — $121.6 million, electricity — $114.4 million, coke and semi-coke — $111 million.
The structure of supplies shows that Poland is not only a trade partner for Ukraine, but also an important energy, industrial and logistics hub.
Germany formed the third largest deficit — $1.94 billion. Ukrainian exports covered 39.5% of imports.
The main publicized positions of German products were passenger cars — $347.6 million, medicines — $220.2 million, petroleum products — $151.9 million, machinery for harvesting agricultural crops — $115.3 million, tillage equipment — $97.1 million, plant protection products — $93.5 million, and tractors — $84.3 million.
The trade deficit with the United States was $1.9 billion, and exports covered only 23.6% of imports. The largest open positions of American supplies were petroleum products — $436.6 million, passenger cars — $417.9 million, hard coal — $182.2 million, and telecommunications equipment — $155.3 million.
Imports from the United States also included tractors, ethylene polymers, petroleum gases, pharmaceuticals, frozen fish, and electronic equipment. A significant part of American and German imports consisted of manufacturing, transport and energy products.
Turkey took fifth place with a deficit of $1.34 billion. At the same time, the ratio of import to export was 57.1% — the highest indicator among the top five.
In the open product structure, radar and radio navigation devices and remote control equipment stood out — $332.8 million. Deliveries of rolled steel, petroleum products — $110.1 million, citrus fruits — $83.3 million, power generators — $73.1 million, sunflower seeds — $59.2 million, automotive components, vegetables and other food products were significant. The Turkish direction combines industrial products, technological equipment, metals and food, but at the same time remains one of the largest markets for Ukrainian exports.
The negative balance of trade with Greece amounted to $861.5 million. Almost $809 million in open commodity breakdown fell on oil and oil products. Among other items were petroleum coke and bitumen — $38.1 million, petroleum gases — $36.4 million, and fertilizers — $35.1 million. The structure of the deficit with Lithuania was similar, reaching $607.7 million. Petroleum products provided $576.1 million of declared imports, petroleum gases — $46.4 million. Also imported were cars, trucks, petroleum coke, fertilizers, polymers and animal feed.
Unlike China, where the deficit is distributed among many technological categories, the imbalance with Greece and Lithuania is largely related to energy purchases.
In trade with the Czech Republic, the deficit amounted to $752.4 million. Among the main import items were aircraft parts - $101.8 million, passenger cars - $101 million, electric generators - $96.6 million, batteries - $44.5 million, telecommunications equipment — $34.3 million, and hard coal — $32.3 million.
The negative balance with Hungary reached $658.1 million. The basis of the open supply structure was electricity — $349.9 million, oil and gas — $157.4 million, cars — $113.2 million, and cable products — $87.8 million.
The deficit with France amounted to $648.9 million. The largest items were plant protection products — $120 million, pharmaceuticals — $76.1 million, cars — $72.5 million, trucks — $47.7 million, tractors — $39.9 million, and automobile components — $35.3 million. The supplies of sunflower seeds, corn, and cosmetics were also significant. products.
Sweden was immediately behind the top ten with a deficit of $606.9 million. Exports covered only 8.3% of imports. Among the main open positions were oil products, automobiles, medicines and agricultural machinery.
The deficit with Taiwan was $563.8 million, with Vietnam — $544.2 million, with Japan — $496.9 million. The ratio of import to export in trade with these countries was only 3.8–5.8%. Unmanned aerial vehicles — $205.3 million, radar and navigation equipment — $58.4 million, integrated electronic circuits — $55 million, and navigation devices — $47.6 million stood out among supplies from Taiwan.
Unmanned aerial vehicles — $132.7 million, telecommunications equipment — $108.7 million, were imported from Vietnam. computer equipment, steel products, shoes, coffee and fish products. Japanese imports were dominated by passenger cars — $302.5 million, as well as motorcycles, auto parts, printing, medical and construction equipment.
The overall structure of purchases explains a significant part of the trade gap. According to the State Customs Service, in the first half of 2026, machinery, equipment and transport accounted for $21.3 billion in imports, fuel and energy products — $7.4 billion, and chemical industry products — $6.9 billion. Together, these three categories provided 72% of imported goods.
Therefore, the deficit is not only related to the consumption of finished foreign products. A significant part of it is formed by purchases of energy carriers, cars, production equipment, electronics, batteries, generators, pharmaceutical products, agricultural machinery and components.
"The trade deficit cannot be evaluated exclusively as a negative indicator. In the conditions of war and large-scale recovery, a significant part of imports has a critical or investment purpose. Ukraine buys energy carriers, generators, batteries, transport, industrial equipment, electronics, medicines and components, without which it is impossible to support the economy, energy and infrastructure," Maksym Urakin, the founder of the Information and Analytical Center Experts Club emphasized.
At the same time, according to him, the concentration of the deficit creates risks of dependence on individual suppliers, increases the demand for foreign currency and demonstrates the insufficient presence of Ukrainian manufacturers in key foreign markets markets.
"The problem arises when the import of finished products systematically increases, and Ukrainian exports and domestic production do not develop at the appropriate pace. Trade with China is especially indicative, where Ukrainian exports cover less than 6% of imports. Such a disparity increases dependence on one supplier and creates a constant additional demand for foreign currency," the economist emphasized.
The most realistic answer, according to Urakin, is not a mechanical restriction of imports, but the localization of production, for which Ukraine has the technological and resource prerequisites, the development of industrial cooperation, the expansion of exports of processed goods, and the involvement of foreign suppliers in the creation of domestic production facilities. countries.
Production of energy equipment, battery systems, electrical engineering, auto components, construction materials, agricultural machinery, food products with a high degree of processing and certain types of chemical products have a special potential.