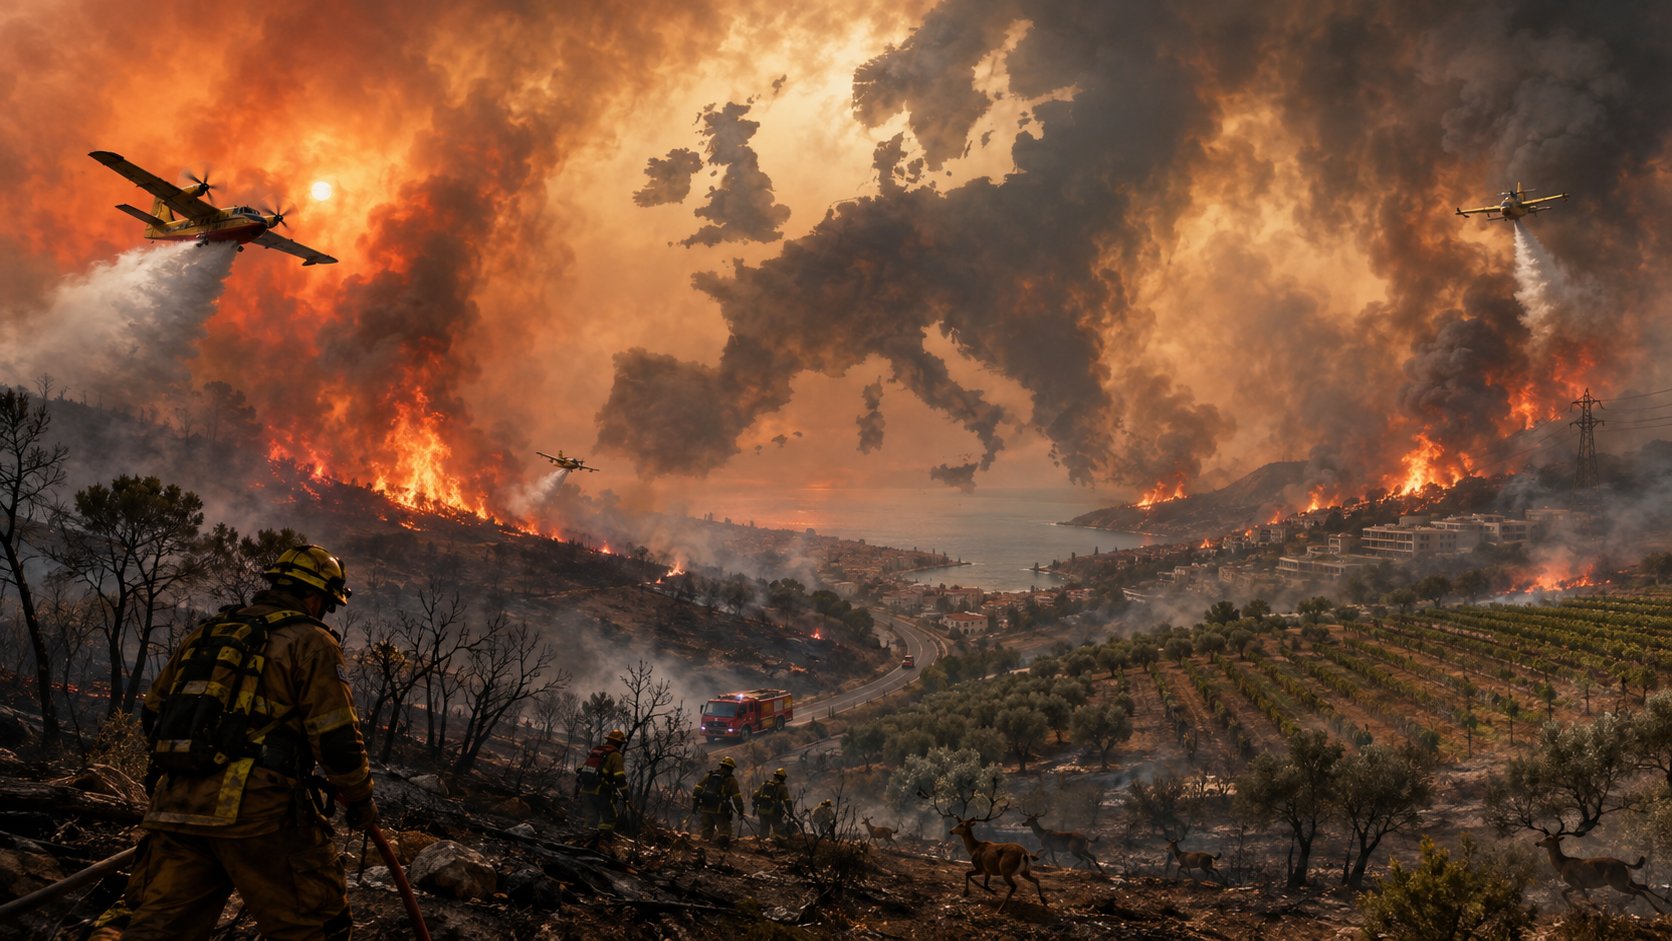
The fire season of 2026 in Europe did not exceed the record of 2025 in terms of total area in the EU, but it became extraordinary in terms of geography and damage structure. According to the operational section of the Global Wildfire Information System (GWIS), read on August 31, 413.1 thousand hectares have been burned in Ukraine since the beginning of the year. If Russia, which GWIS takes into account by its entire territory together with Siberia and the Far East, is taken outside the direct European comparison, Ukraine ranks first in absolute area, Spain second, Italy third, France fourth.
The picture is different in terms of territory share. In Montenegro, fires covered 1.74% of the country's area, in Bosnia and Herzegovina — 1.05%, in North Macedonia — 0.775%. Ukraine, with an indicator of 0.687%, is approximately in the fourth position. At the same time, the biggest deviation from its own long-term norm is recorded not in the south, but in Belgium: its current area of fires is 10.36 times higher than the average for the full years 2012-2025.
The key conclusion is that in 2026 it is not possible to single out a single "most fire-affected" country. Russia has the largest absolute area in the GWIS array, Ukraine has the largest area among the countries that can be more correctly compared in geographical Europe, Montenegro has the largest share of territory, and Belgium has the largest excess of its own historical norm.
Two systems of the Joint Research Center of the European Commission were used for the study. GWIS generates operational estimates based on MODIS and VIIRS thermal anomalies combined into fire events. This approach provides fast and broad coverage, but may involve controlled burns and does not always accurately separate vegetation, forest, farmland, and other fires. The European Forest Fire Information System (EFFIS) maps mainly fires of about 30 hectares and more, uses MODIS, VIIRS and Sentinel-2 optical images and refines perimeters visually. The JRC estimates that the events covered by EFFIS account for around 95% of the total burned area in the EU, although the system may also include prescribed and controlled burns.
Due to different methodologies, the numbers are not interchangeable. For example, at the time of the cut, GWIS estimated Spain at 242.1 thousand hectares and EFFIS at 295.6 thousand hectares; for Italy, the corresponding indicators were 118.3 thousand hectares and 96.5 thousand hectares. They cannot be added to or construed as mutually validating. GWIS was used for the pan-European rating, EFFIS for the control assessment of the situation in the EU.
The official JRC page, updated on 31 August at 09:18 CEST, reports that by 30 August 636,100 hectares had burned in the EU in 1,861 major fires. That's 36% less than the same date in 2025's record year of 993,300 ha, but the weekly figure for August 26 of 634,000 ha was more than double the 2006-2025 average for that date of 313,200 ha. According to EFFIS, Spain, France, Italy, Portugal and Greece together accounted for about 92% of the burned area of the EU.
According to these data, as of the end of the summer, the fastest growing estimates were for Montenegro, North Macedonia, Ukraine and the Russian Federation. At the same time, part of the increase reflects both new fires and refinements of already recorded events.
GWIS rating by absolute area of fires
Place | Country | Burned area in 2026, ha | Part of the country's territory | 2026 to the average for 2012-2025 | |||||||||||||||||||||||||||||||||||||||||||||||||||||||||||||||||||||||||||||||||||||
|---|---|---|---|---|---|---|---|---|---|---|---|---|---|---|---|---|---|---|---|---|---|---|---|---|---|---|---|---|---|---|---|---|---|---|---|---|---|---|---|---|---|---|---|---|---|---|---|---|---|---|---|---|---|---|---|---|---|---|---|---|---|---|---|---|---|---|---|---|---|---|---|---|---|---|---|---|---|---|---|---|---|---|---|---|---|---|---|---|---|
1 | Russia, European part | ≈450,000; range of 300–600 thousand (6,749,571 in the entire territory of the Russian Federation, according to GWIS data) | ≈0.114%; range 0.076–0.152% (0.3988%) | ≈47.1% | |||||||||||||||||||||||||||||||||||||||||||||||||||||||||||||||||||||||||||||||||||||
2 | Ukraine | 413 121 | 0.6870% | 42.0% | |||||||||||||||||||||||||||||||||||||||||||||||||||||||||||||||||||||||||||||||||||||
3 | Spain | 242 108 | 0.4785% | 144.1% | |||||||||||||||||||||||||||||||||||||||||||||||||||||||||||||||||||||||||||||||||||||
4 | Italy | 118,258 | 0.3924% | 79.1% | |||||||||||||||||||||||||||||||||||||||||||||||||||||||||||||||||||||||||||||||||||||
5 | France | 105 114 | 0.1905% | 248.3% | |||||||||||||||||||||||||||||||||||||||||||||||||||||||||||||||||||||||||||||||||||||
6 | Portugal | 60,515 | 0.6563% | 50.4% | |||||||||||||||||||||||||||||||||||||||||||||||||||||||||||||||||||||||||||||||||||||
7 | Bosnia and Herzegovina | 53,825 | 1.0511% | 85.9% | |||||||||||||||||||||||||||||||||||||||||||||||||||||||||||||||||||||||||||||||||||||
8 | Romania | 33,377 | 0.1400% | 19.5% | |||||||||||||||||||||||||||||||||||||||||||||||||||||||||||||||||||||||||||||||||||||
9 | Serbia | 29,587 | 0.3348% | 43.2% | |||||||||||||||||||||||||||||||||||||||||||||||||||||||||||||||||||||||||||||||||||||
10 | Great Britain | 28,299 | 0.1162% | 190.4% | |||||||||||||||||||||||||||||||||||||||||||||||||||||||||||||||||||||||||||||||||||||
11 | Greece | 25,451 | 0.1929% | 37.5% | |||||||||||||||||||||||||||||||||||||||||||||||||||||||||||||||||||||||||||||||||||||
12 | Montenegro | 23,205 | 1.6801% | 65.5% | |||||||||||||||||||||||||||||||||||||||||||||||||||||||||||||||||||||||||||||||||||||
13 | North Macedonia | 19,238 | 0.7482% | 62.9% | |||||||||||||||||||||||||||||||||||||||||||||||||||||||||||||||||||||||||||||||||||||
14 | Albania | 16,325 | 0.5679% | 35.5% | |||||||||||||||||||||||||||||||||||||||||||||||||||||||||||||||||||||||||||||||||||||
15 | Belarus | 15,617 | 0.0752% | 31.6% | |||||||||||||||||||||||||||||||||||||||||||||||||||||||||||||||||||||||||||||||||||||
16 | Bulgaria in the line of indicators of the Russian Federation, data for the entire internationally recognized territory of Russia is given. Crimea and other temporarily occupied territories of Ukraine are not included in the European part of Russia.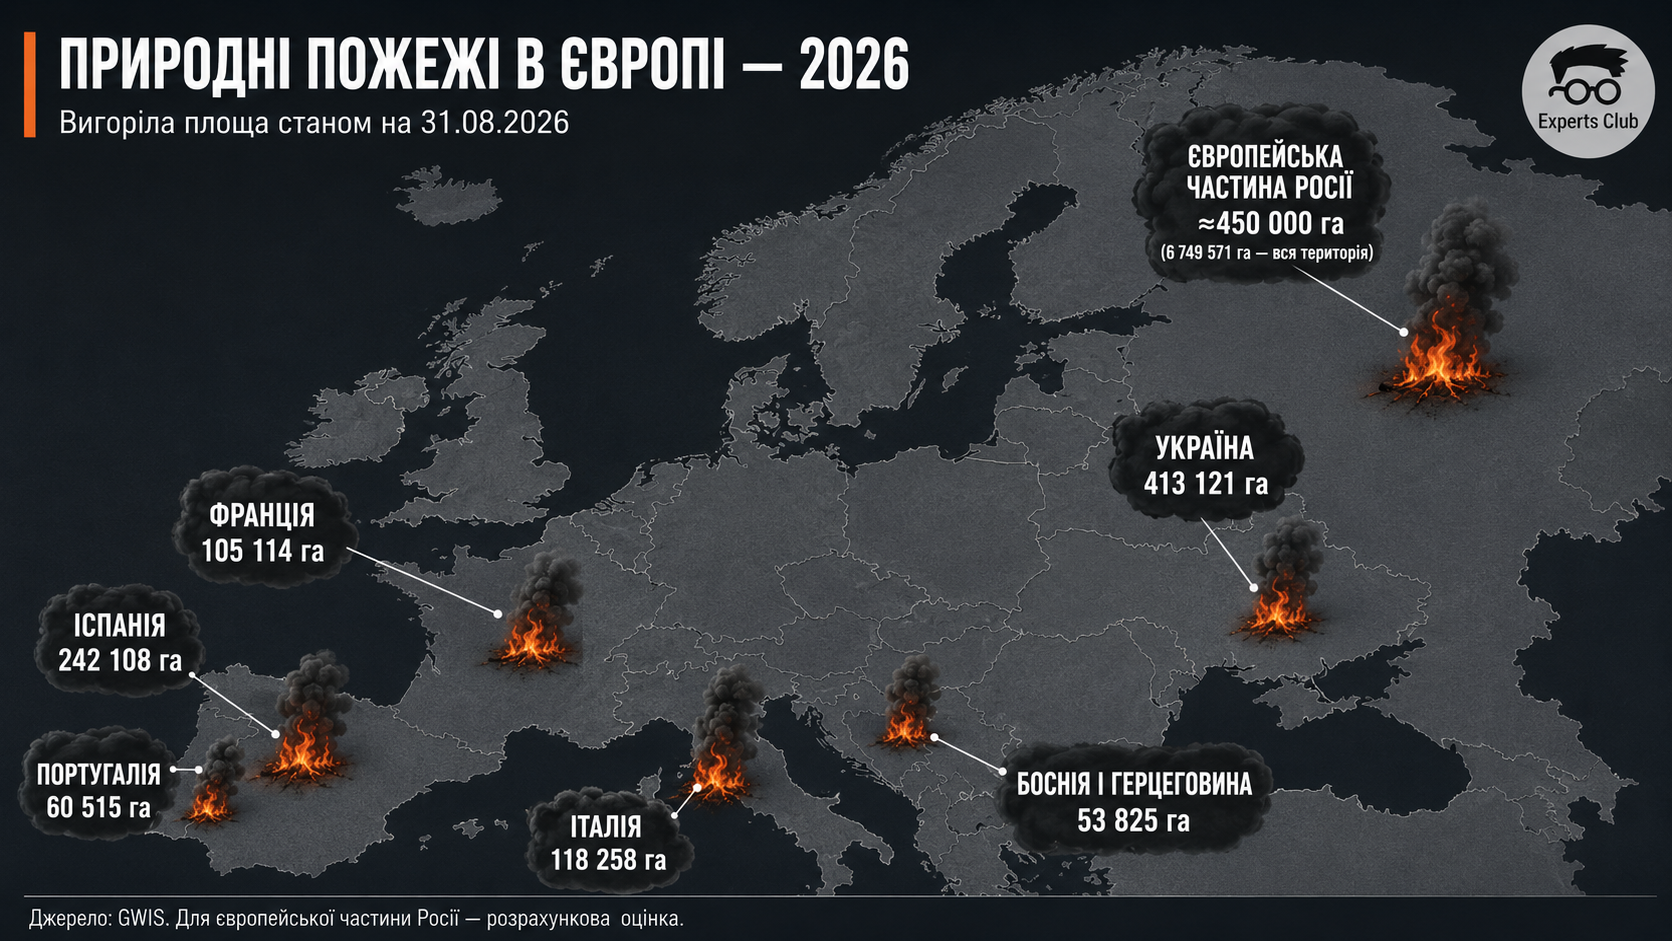 Montenegro has already lost 1.74% of its territory, but this is only about 66% of its average full year for 2012-2025. The situation is similar in Bosnia and Herzegovina, North Macedonia and Albania: the local load is very high, but the historical base also reflects regular large fires. On the contrary, for the countries of North-West and Central Europe, a small part of the territory may be unprecedented. The current indicator of Belgium is 10.36 times higher than the average for a full year, the Netherlands — 3.08 times, Austria — 2.55 times, France — 2.48 times, Germany — 1.91 times, Great Britain — 1.90 times. In Belgium, one large-scale outbreak in the High Fens natural area covered about 3,000 hectares and radically changed national statistics. Rating by exceeding its own average annual fire rate
This indicator deliberately compares the incomplete year 2026 to the average full year. It shows well where the season has already gone beyond the usual annual scale, but is not a classic comparison with the same calendar date and should not be called a statistical "anomaly" without additional seasonal analysis. Ukraine: natural fires and warUkraine's figure of 413.1 thousand hectares is 35% more than in the original section, and about 0.69% of the country's internationally recognized territory. In absolute terms, Ukraine is ahead of Spain by 171,000 hectares. However, the satellite system records the fact of the passage of the fire, but not its cause. In the conditions of war, shelling, explosions and fires along the front line are added to heat, drought, carelessness and arson. Because of this, the average GWIS indicator for the years 2012-2025 — 984.8 thousand ha — is unsuitable as a "pure" climate norm for Ukraine, because it includes years of full-scale war with exceptional areas of frontline fires. Correct attribution requires at least separate databases before 2022 and after February 24, 2022, as well as overlaying perimeters on combat data, land cover type, and industrially contaminated areas. The JRC has already recorded the special role of Ukraine: in 2025, it accounted for almost 30% of the entire area mapped by EFFIS in the wider region of Europe, the Middle East and North Africa. The Balkans: the maximum burden on small countriesMontenegro, Bosnia and Herzegovina, North Macedonia, Albania and Serbia together have about 142.2 thousand hectares per GWIS. For large countries, this is not a record, but for small mountainous countries it means a simultaneous blow to forests, pastures, water catchments, roads, energy networks and tourist areas. The high vulnerability of the region is formed not only due to weather conditions, but also due to the outflow of the population from rural areas, the decline of traditional grazing and land cultivation, the accumulation of dry biomass, and fragmented construction on the border of the forest and settlements. and limited aviation resources compounding the effects. Therefore, the proportion of burned area here better describes the pressure on national ecosystems and budgets than the place in the absolute ranking. Ecological impactFire transforms carbon accumulated in vegetation and soil into carbon dioxide, carbon monoxide, methane, black and organic carbon, and fine dust. At the same time, a burnt forest or shrub temporarily loses its ability to absorb CO₂. This is a dual effect—immediate emissions plus attenuation of future uptake, although its duration depends on fire severity and ecosystem recovery. CAMS in July recorded record fire emissions for the time of year in France and significantly higher than average in Spain. In Bordeaux, the daily concentration of PM2.5 exceeded 300 μg/m³ against the European reference level of 25 μg/m³; in Madrid, 80–100 μg/m³ were observed. The WHO emphasizes that PM2.5 particles penetrate deep into the lungs and bloodstream, exacerbate asthma, chronic lung and heart diseases and can increase the need for hospitalization. Therefore, the zone of medical and economic influence is much wider than the visible perimeter of the fire. The burnt area is not equal to the destroyed forest: it can include meadows, shrubs, peatlands, agricultural lands and controlled burning. However, large and repeated fires fragment habitats, destroy breeding sites, change species composition, and facilitate the spread of invasive species. The scale of the risk is visible from the previous season: in 2025, 424,000 hectares, or 39% of the burnt area of the EU, fell on the territory of Natura 2000. The full assessment for 2026 will appear only after the final mapping. After severe burning, the soil loses organic matter and protective vegetation, becomes vulnerable to erosion and intensive runoff. Ash, nutrients, metals and combustion products end up in rivers and reservoirs, increasing water treatment costs. The EEA separately warns about secondary risks: floods, ecological droughts, outbreaks of pests and diseases. In 2026, these risks are superimposed on drought: in July, 50% of the EU and Great Britain were under some level of drought stress, and major European rivers dropped to record low levels. Main ecological consequences of exceeding the annual fire rate
Economic consequencesFire area alone does not measure financial loss. One hectare near a city, a resort, an industrial hub or a power line can cost hundreds of times more than a hectare of remote unproductive vegetation. Therefore, the economic assessment must take into account at least six blocks. The first is the physical destruction of housing, commercial buildings, roads, networks, equipment and supplies. The second is the costs of extinguishing, aviation, evacuation, temporary accommodation, medical assistance and debris removal. The third is the loss of forest and agricultural sectors: wood, fodder base, orchards, vineyards, livestock and future yield. The fourth is the suspension of business, transport restrictions and cancellation of tourist trips. The fifth is medical expenses and lost work time due to smoke and stress. The sixth is multi-year landscape reclamation, anti-erosion works and restoration of catchments. The European Commission estimates the typical annual fire damage to property and infrastructure in the EU at around EUR2.5 billion. A private AccuWeather estimate, provided by Reuters on August 6, gave a much wider range of EUR15.6-19.1 billion for large fires in the summer of 2026, including property, infrastructure, extinguishing, cleaning and expected insurance claims. This is not an official balance and not the final result of the season, but a model operational evaluation; it cannot be directly compared with the average annual indicator of the Commission due to the different composition of costs. Estimates of losses from fires on the territory of the EU
The disparity between the figures shows a major accounting problem: the "cost of fires" depends on the assessment limits. National registries often capture insured property and budget costs, but do not fully capture the loss of ecosystem services, health, small business income, and tourism reputation. According to the EEA, between 1980 and 2024 private insurance covered less than 20% of all climate losses in the EU, and only slightly more than 10% for the group of climate risks, which include heat, drought and fire. The rest falls on households, companies and state budgets. The operational pressure of 2026 is visible even without the final balance sheet. During the July fires in France and Spain, more than 300,000 people were displaced; The EU sent seven planes and four helicopters to France, six planes, 134 rescuers and 41 vehicles to Spain. The entire joint reserve system for the season consisted of 22 aircraft and five helicopters, and almost 800 firefighters were pre-positioned in high-risk areas. This reduces losses, but at the same time demonstrates that fires have already become a permanent item of European security costs. ConclusionsAs of the end of August 2026, Europe is experiencing a season that is not a record for the EU, but a very difficult and geographically unusual one. The South-West concentrates the main area in the EU, the Balkans have the largest load relative to the size of the states, North-Western Europe is the strongest deviation from the usual regime, and the indicator of Ukraine cannot be fully explained without taking into account the war. One rating of hectares is not enough for a final assessment. The minimum set should include absolute area, proportion of area, comparison with historical seasonal norm, burn severity, land cover type, proportion of protected areas, emissions, population and assets at risk, direct and indirect economic losses. Only such a system will distinguish a large fire in a remote area from a disaster that destroys ecosystems, health, business and public finances. Political priority is shifting from pure mitigation to risk management: restoration of mosaic landscapes, grazing and control of fuel, mixed forest stands, protection of peatlands and watersheds, fire planning for development and early warning. The assessment of the European Commission that up to 96% of occupations in the EU can be related to human activity is indicative. Therefore, a significant part of the risk is formed before the fire occurs - in land use, infrastructure, behavior and the quality of management. Primary sources: JRC, GWIS Statistics Portal, EFFIS Statistics Portal, GWIS, EFFIS, JRC, European Commission, EEA, CAMS, WHO/Europe, EEA, JRC, European Civil Protection and Humanitarian Aid Operations, Reuters. Related storiesFrom the section Economy  Economy Ринок токенізованих реальних активів перевищив $39 млрд, держоблігації США досягли $14 млрдEditorial team  Economy Нідерланди очолили світовий рейтинг пенсійних систем 2026 року, Україна до дослідження не увійшлаEditorial team  Economy В’єтнам планує запровадити спеціальну візу для висококваліфікованих іноземцівEditorial team |