Ukraine's foreign trade in goods in January-August 2026 was characterized by a significant excess of imports over exports and a concentration of negative balance in relations with several of the largest partners. According to calculations based on the table "Foreign trade of Ukraine with individual countries" as of August 31, the turnover amounted to $92.95 billion, imports - $66.25 billion, exports - $26.70 billion. The negative balance reached $39.55 billion, and imports exceeded exports by 2.48 times.
Exports covered only 40.3% of the value of imported goods. China was the largest single trade partner and supplier, Poland was the main market for Ukrainian products, and the European Union in general accumulated 59.1% of Ukraine's commodity exports. At the same time, the largest positive balances were formed in trade with Moldova, Spain, and Egypt.
"For every hundred dollars of merchandise imports, there were approximately forty dollars of merchandise exports. This ratio shows the limited opportunities of the export sector to balance the economy's need for foreign products. Part of the import supports production and recovery, so it should be evaluated taking into account the purpose of the goods. For a long-term improvement of the balance, it is necessary that the purchased equipment helps to increase the production of competitive products in Ukraine", - says Maksym Urakin, PhD, founder of the Experts Club information and analytical center. alt="">
Total volume of trade and largest partners
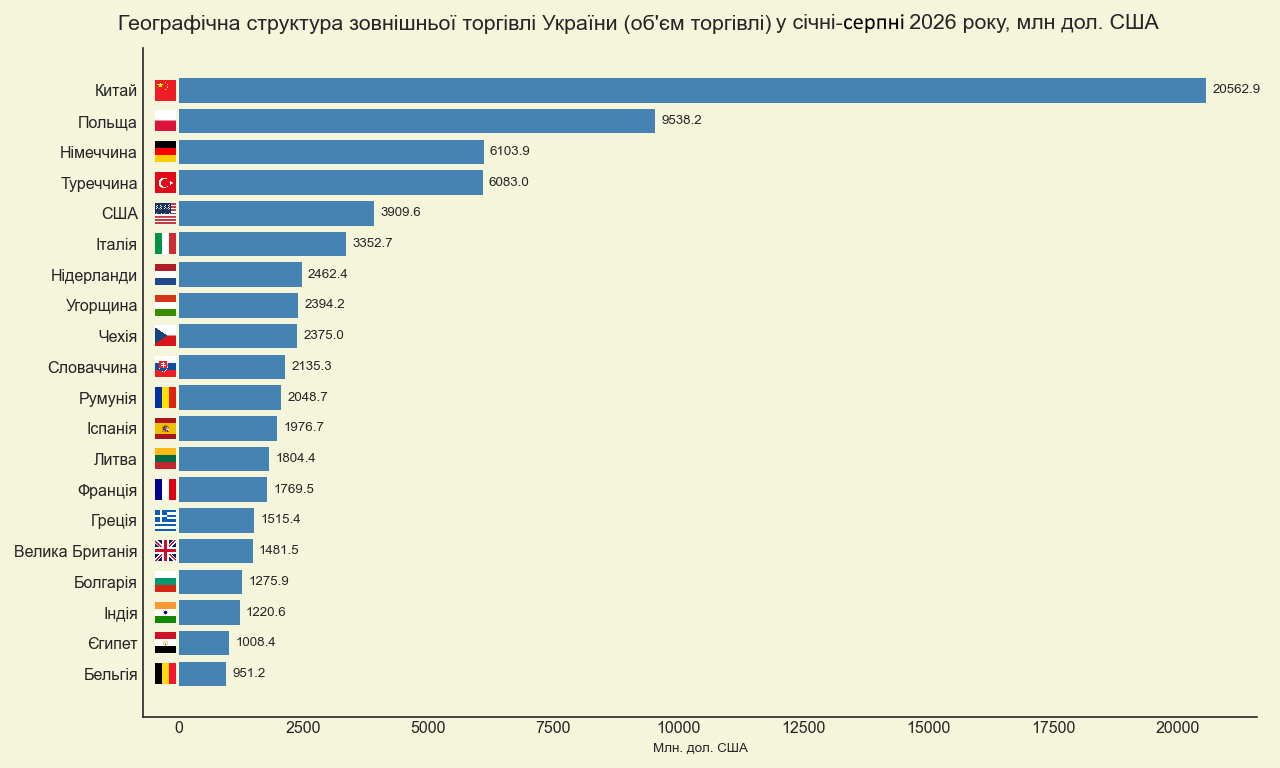
Ukraine had the largest turnover with China - $20.56 billion, or 22.1% of the total volume. Poland was in second place with $9.54 billion, and Germany in third place with $6.10 billion. Ukraine had practically the same amount of trade with Turkey – $6.08 billion, and the gap with Germany was only $20.9 million. The top five partners were closed by the United States with $3.91 billion.
These five countries accounted for 49.7% of trade turnover, and the ten largest partners accounted for 63.4%. Therefore, the results of trade with a relatively small group of states largely determined the overall foreign trade balance of Ukraine.
Ten largest partners of Ukraine by trade turnover in January-August 2026, billion US dollars
Country | Imports | Exports | Balance | Trade |
China | 19.639 | 0.924 | −18,715 | 20,563 |
Poland | 6,277 | 3,261 | −3,016 | 9,538 |
Germany | 4,377 | 1,726 | −2,651 | 6,104 |
Turkey | 3,991 | 2,092 | −1,899 | 6,083 |
USA | 3,210 | 0,700 | −2,510 | 3,910 |
Italy | 1,834 | 1.519 | −0.315 | 3.353 |
Netherlands | 1.151 | 1.311 | +0.160 | 2.462 |
Hungary | 1.549 | 0.846 | −0.703 | 2,394 |
Czech Republic | 1,670 | 0,705 | −0.965 | 2.375 |
Slovakia | 1.343 | 0.792 | −0.551 | 2.135 |
Source: State Customs Service of Ukraine
Among the next largest partners are Romania with a turnover of $2.05 billion, Spain – $1.98 billion, Lithuania – $1.80 billion, France – $1.77 billion and Greece – $1.52 billion. The total turnover with 27 EU states was $43.60 billion, or 46.9% of the total. Ukrainian exports to the EU were equal to $15.78 billion, imports - $27.81 billion, and the deficit - $12.03 billion.
The high share of the EU in exports means that access to the European market is of decisive importance for Ukrainian manufacturers. At the same time, significant volumes of purchases in the countries of the Union form a separate source of trade deficit. Within this area, the situation is heterogeneous: the biggest gap is between Poland and Germany, while Ukraine has a positive balance with Spain and the Netherlands.
Imports and dependence on major suppliers
China provided $19.64 billion of imports, or 29.6% of the total volume of goods imported. Deliveries from Poland amounted to $6.28 billion, or 9.5%, from Germany - $4.38 billion, or 6.6%. Together, these three countries accounted for 45.7% of Ukrainian merchandise imports.
The top five suppliers also included Turkey with $3.99 billion and the United States with $3.21 billion. The combined share of the first five reached 56.6%, and the top ten suppliers – 68.3%. Other major sources of imports include Italy with $1.83 billion, the Czech Republic with $1.67 billion, Hungary with $1.55 billion, Slovakia and Lithuania with approximately $1.34 billion each. alt="">
The general product structure for the same period is disclosed by the State Customs Service. In January-August 2026, Ukraine imported machines, equipment and transport for more than $29.9 billion, fuel and energy products for more than $9.5 billion, chemical industry products for more than $9 billion. These categories accounted for more than 73% of imports; the share of machines, equipment and transport was about 45%.
This ratio indicates a large role of industrial and energy products in imports. However, the consolidated category of machines and transport combines goods of different purposes. Its volume cannot be interpreted entirely as investment in production: for this, it is necessary to separately analyze the equipment of enterprises, assembly plants, transport and final consumer goods.
"The concentration of almost a third of imports on one supplier makes Ukrainian business sensitive to the conditions of supplies from China. Disruptions in logistics or changes in prices for components can affect many enterprises at once. At the same time, a reduction in purchases without an affordable replacement can limit Ukrainian production itself. The practical task is to expand the range of suppliers and develop local production of those goods for which there are economic and technological prerequisites in Ukraine," Urakin comments.
Export and sales geography
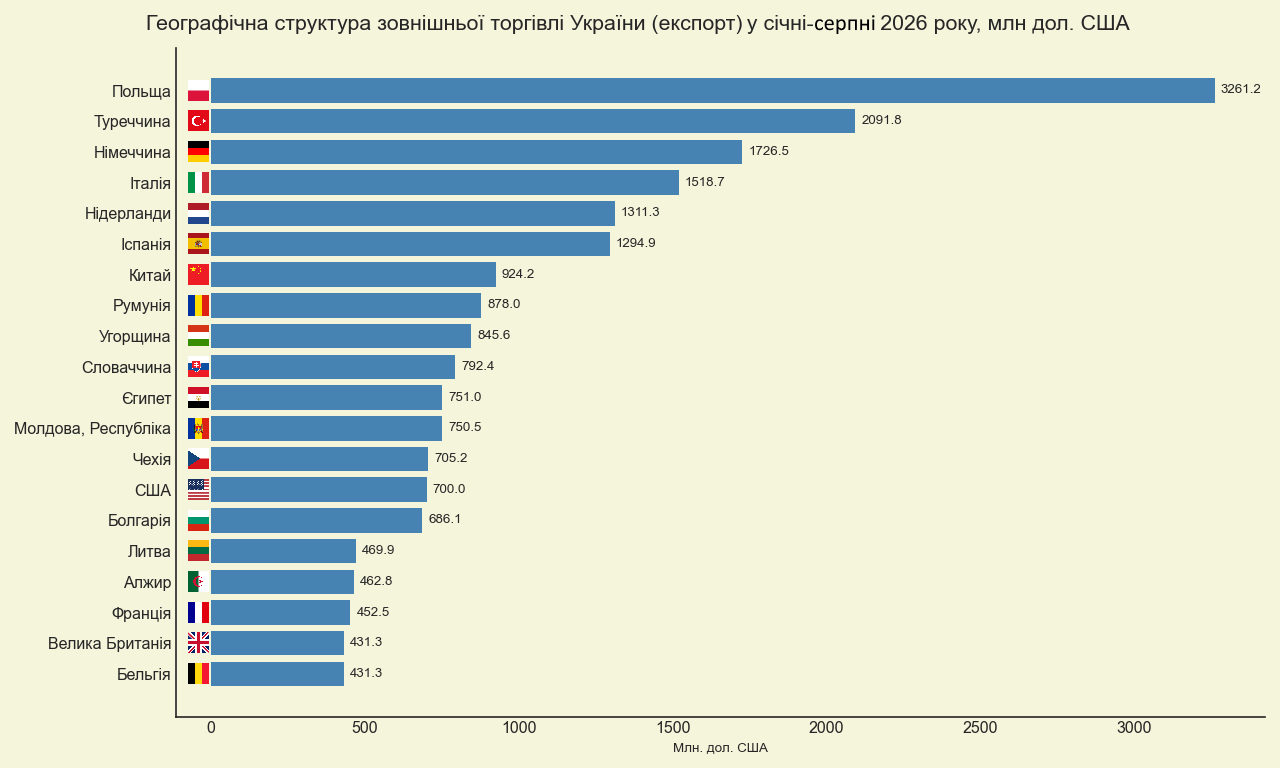
Poland remained the largest sales market, where $3.26 billion worth of goods were delivered, or 12.2% of total Ukrainian exports. Turkey took second place with $2.09 billion and a share of 7.8%, and Germany took third place with $1.73 billion and 6.5%. Next came Italy - $1.52 billion, the Netherlands - $1.31 billion and Spain - $1.29 billion.
Exports to China amounted to $924.2 million, to Romania - $878.0 million, Hungary - $845.6 million, Slovakia - $792.4 million. Egypt and Moldova bought Ukrainian goods worth $751.0 million and $750.5 million, respectively. The volume of deliveries to the Czech Republic amounted to $705.2 million, to the USA - $700.0 million.
Exports were less concentrated in individual countries than imports: the three largest markets accounted for 26.5% of deliveries, the five largest markets accounted for 37.1%, and the ten largest markets accounted for 54.8%. At the same time, the dominance of the EU as a collective market means that the diversity of destination countries only partially reduces dependence on the economic and regulatory conditions common to them.
According to the State Customs Service, in eight months food exports exceeded $15.4 billion, exports of metals and their products approached $2.7 billion, machines, equipment and transport - up to $2.4 billion. The estimated shares of these groups in total exports were 58%, 10% and 9%, respectively. Food products remained the main source of merchandise export revenue.
"The geography of exports gives Ukraine the opportunity to work with various markets, but the product structure remains largely dependent on food. For such deliveries, the harvest, world prices and the cost of transportation are of significant importance. The development of processing can increase revenue from a unit of raw materials, although it requires investments and a stable energy supply. At the same time, it is necessary to expand industrial exports so that the results of several agrarian product groups determine the overall picture less," Maksym Urakin notes.
Negative balance and deficit concentration
The largest bilateral deficit was formed in trade with China - $18.71 billion. Its value was equal to 47.3% of the net commodity deficit of Ukraine. Exports to China covered only 4.7% of imports from this country, and imports of Chinese goods accounted for 95.5% of bilateral trade.
The second largest trade deficit was with Poland - $3.02 billion. It was followed by Germany - $2.65 billion, the United States - $2.51 billion and Turkey - $1.90 billion. Together, the negative balance with these five states amounted to $28.79 billion.
Notable deficits were also recorded in trade with Greece - $1.07 billion, the Czech Republic - $964.7 million, Lithuania - $864.6 million, France - $864.5 million, and Taiwan - $844.5 million. Therefore, the imbalance went far beyond relations with one of the largest suppliers.
The amount of negative balances for all deficit areas reached $43.90 billion. Positive balances in other lines of the table reduced it by $4.35 billion to a total deficit of $39.55 billion. Accordingly, China formed 42.6% of the sum of bilateral deficits, and the five largest deficit areas accounted for 65.6%. This more accurately reflects their concentration than a comparison with only the net total after accounting for surpluses.
“The deficit with China is larger in scale than the negative balance with all EU countries combined. This shows how unevenly distributed Ukraine's import dependence is. At the same time, bilateral deficit alone does not determine whether trade with a particular country is economically beneficial. It is necessary to evaluate how imported goods are used inside the country and what contribution they make to employment, production and future exports," Urakin emphasizes.
Positive balance and markets with a predominance of Ukrainian supplies
Ukraine had the largest positive balance in trade with Moldova - $640.6 million. For exports of $750.5 million, imports from this country amounted to $109.9 million, i.e. Ukrainian supplies exceeded the counter by almost 6.8 times. The second place in terms of surplus was taken by Spain - $613.0 million: exports to it reached $1.29 billion, imports - $681.8 million.
The third largest surplus was with Egypt - $493.5 million. It was followed by Algeria - $361.0 million, Lebanon - $258.7 million and Libya - $219.8 million. A positive balance with Iraq amounted to $169.1 million, the Netherlands - $160.1 million, Tunisia - $157.0 million, Yemen - $134.0 million. the largest surpluses - with Moldova, Spain, Egypt, Algeria and Lebanon - provided $2.37 billion, or 54.4% of the sum of all positive balances. However, in general, surplus directions compensated only 9.9% of the sum of bilateral deficits. Even successful export markets have not yet provided a sufficient scale of revenue to offset purchases from the largest suppliers.
"Moldova, Spain and Egypt show that Ukraine has markets with a significant excess of its own supplies over imports. They should be considered as a basis for expanding the assortment and strengthening long-term relations with customers. However, the high surplus of a particular direction does not mean that it can be quickly increased without restrictions on demand. In order to have a noticeable impact on the overall balance, a simultaneous increase in exports in many markets is needed," Maksym Urakin believes.
Commodity structure of trade with individual countries
Detailing by products makes it possible to better explain the differences between trade directions. Below, the indicators for January-August 2026 are supplemented with reference data for 2025 and other directly indicated periods. Historical shares characterize the relevant period and are not automatically transferred to eight months of 2026.
According to GMK Center calculations based on data from the State Customs Service, in January-August 2026, Ukraine supplied China with 7 million tons of iron ore - 38% less than a year earlier. This is approximately 44% of all physical exports of Ukrainian ore during this period, which amounted to 15.8 million tons. The Chinese market thus remained extremely important for the mining industry, although total Ukrainian exports to the PRC were much smaller than imports.
For its part, the National Institute for Strategic Studies noted in the results of 2025 that machinery, equipment and transport made up 69.8% of Ukrainian imports from China. A comparison of these data from different periods indicates the difference in product profiles of bilateral trade: the large role of industrial products in Chinese supplies is combined with the importance of raw materials in Ukrainian exports. It is possible to determine the exact structure of this exchange for eight months of 2026 only by fully detailing the commodity positions.
In January-August 2026, 2.1 million tons of Ukrainian iron ore were shipped to Poland. For comparison, Slovakia received 2.9 million tons during the same period. These indicators illustrate the role of both markets in the sale of products of the Ukrainian mining industry.
A broader Polish product profile is contained in the answer of the Ministry of Development and Technology of Poland to the parliamentary request No. 17426, reproduced in the Politoskop database. According to the GUS data provided there for 2025, soybean oil for €399.7 million, iron ores and concentrates for €342.3 million, and ferrous metal rolling for €315.5 million were among the major shipments from Ukraine to Poland for 2025. In the reverse direction, significant volumes were accounted for by petroleum products - €1.76 billion, unmanned aerial vehicles - €759.6 million, and passenger cars - €555.8 million. These are the data of Polish statistics for the full year 2025, so they serve as a separate characteristic of the product mix.
According to the preliminary data of German official agricultural statistics for 2025, manufactured goods accounted for about 94% of German supplies to Ukraine. At the same time, Germany imported agricultural and food products from Ukraine for approximately €1.3 billion and goods from the industrial sector - for €1.8 billion. Oil crops, primarily rapeseed, as well as vegetable oils for €172 million and fruit processing products and fruit preserves for €101 million stood out among the agricultural supplies. This structure shows that Ukrainian exports to Germany also include a significant industrial component.
According to the analysis NISD, in 2025, an important position of Ukrainian exports to this country was corn, the supply of which amounted to about $1.2 billion. In imports from Turkey, petroleum products amounted to $639 million, and the aggregated category "other goods" - $2.1 billion. The latter, without additional detail, is not correctly identified with a specific industry. Data for January–August 2026 also confirm the existence of a metallurgical direction: according to GMK Center calculations, 83.2 thousand tons of Ukrainian pig iron were exported to Turkey.
In January–August 2026, the United States purchased 900.6 thousand tons of Ukrainian pig iron, while the total export of these products was about 1.03 million tons. Therefore, the American market accounted for approximately 87% of the physical volume of deliveries. 26.5 thousand tons arrived in Italy during the same period. The concentration of sales of an individual product on one market can be significantly higher than the concentration of all Ukrainian exports by country.
Data of the Verkhovna Rada Committee on Agrarian and Land Policy with reference to the State Customs Service show the importance of the markets of Spain, Italy and India for the oil industry. In the first half of 2025, Spain purchased Ukrainian sunflower oil for $356.9 million, Italy for $337.5 million, and India for $326.1 million. Their shares in the export value of this product were 12.88%, 12.18%, and 11.77%, respectively. This is an example of the specialization of individual markets in the sale of Ukrainian processed agricultural products, and not an assessment of their shares for January-August 2026.
Consequences for the economy and conditions for improving the balance sheet
Geographical and commodity data indicate a combination of high demand for imported industrial products with exports, in which food products prevail, and in certain directions, they play a significant role ore and metallurgical products. With such a ratio, the possibilities of improving the balance depend on production capacities, energy supply, available logistics, and conditions for entering foreign markets.
At the same time, the deficit in trade in goods is not equal to the deficit of the entire balance of payments or the automatic reduction of foreign exchange reserves by the same amount. External financing is also affected by trade in services, income, transfers and financial transactions. Therefore, $39.55 billion characterizes the gap between export and import of goods within the given statistics.
"Improving the trade balance requires expanding the capacity of Ukrainian enterprises to produce and sell abroad. Equipment purchases can contribute to this if they are accompanied by investment in production, access to energy and clear working conditions. For exporters, stable transportation and the ability to fulfill contracts without forced interruptions are just as important. It is the growth of competitive domestic production that can gradually reduce the gap between imports and exports," concludes Maksym Urakin.