Trade, International Priorities, and Ukrainians’ Attitudes Toward Countries Around the World: Experts Club Analysis
Редакція•
In August 2026, Active Group, jointly with the Experts Club information and analytical center, conducted the third wave of the study “Ukrainians’ Attitudes Toward Countries Around the World,” in which the public perception of countries was compared with their actual role in Ukraine’s foreign trade. The study revealed a significant gap between the economic weight of individual partners and Ukrainians’ attitudes toward them: China, which became Ukraine’s largest trading partner in the first half of 2026 with trade turnover of about $14.68 billion, at the same time recorded the lowest balance of positive and negative assessments, at minus 25.4 percentage points. By contrast, the best attitude balance was recorded for Canada, at plus 73.8 percentage points. The study also covered changes in attitudes toward key partners, Ukrainians’ priorities regarding the development of trade and economic relations, and assessments of the role of various countries in contributing to the achievement of peace in Ukraine. This was the third wave of the survey, following studies conducted in August 2025 and March 2026; in August 2026, 800 adult citizens of Ukraine were surveyed, and the declared maximum theoretical margin of error was 3.5%.
The study “Ukrainians’ Attitudes Toward Countries Around the World” combines two important dimensions — the actual intensity of Ukraine’s foreign economic ties and the public perception of other countries. This approach makes it possible to see how closely the trade weight of a particular country corresponds to the level of positive attitudes toward it among Ukrainians. In many cases, there is no direct correlation: significant trade turnover may coexist with low public assessments, while countries with smaller volumes of trade may enjoy considerably greater public sympathy.
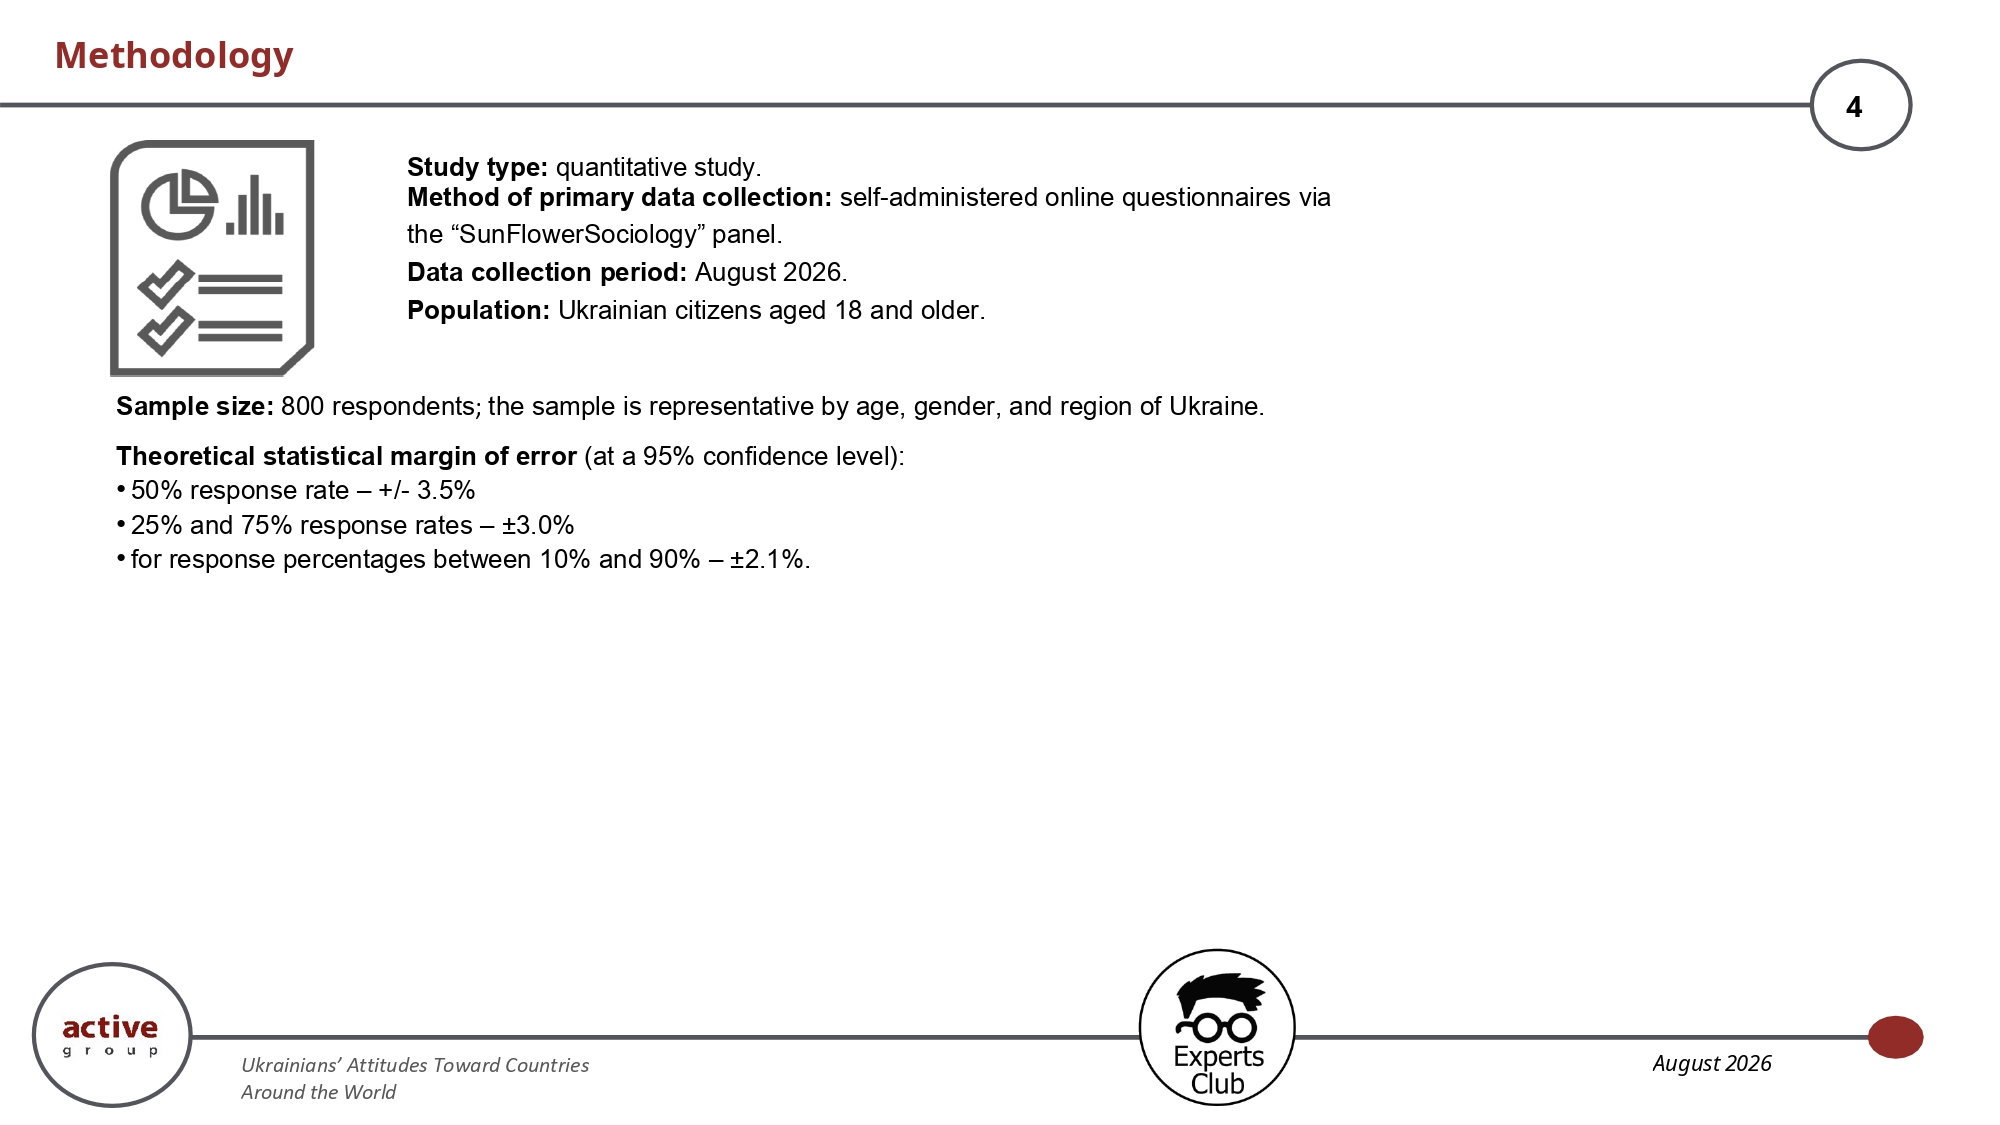
The survey was conducted in August 2026 using an online self-administered questionnaire in the SunFlowerSociology panel among 800 Ukrainian citizens aged 18 and over. The sample is representative by age, gender, and region, while the maximum theoretical margin of error for indicators at the 50% level is ±3.5 percentage points. Therefore, when interpreting close values for individual countries, it is more important to assess overall groups and trends than minor differences of several points.
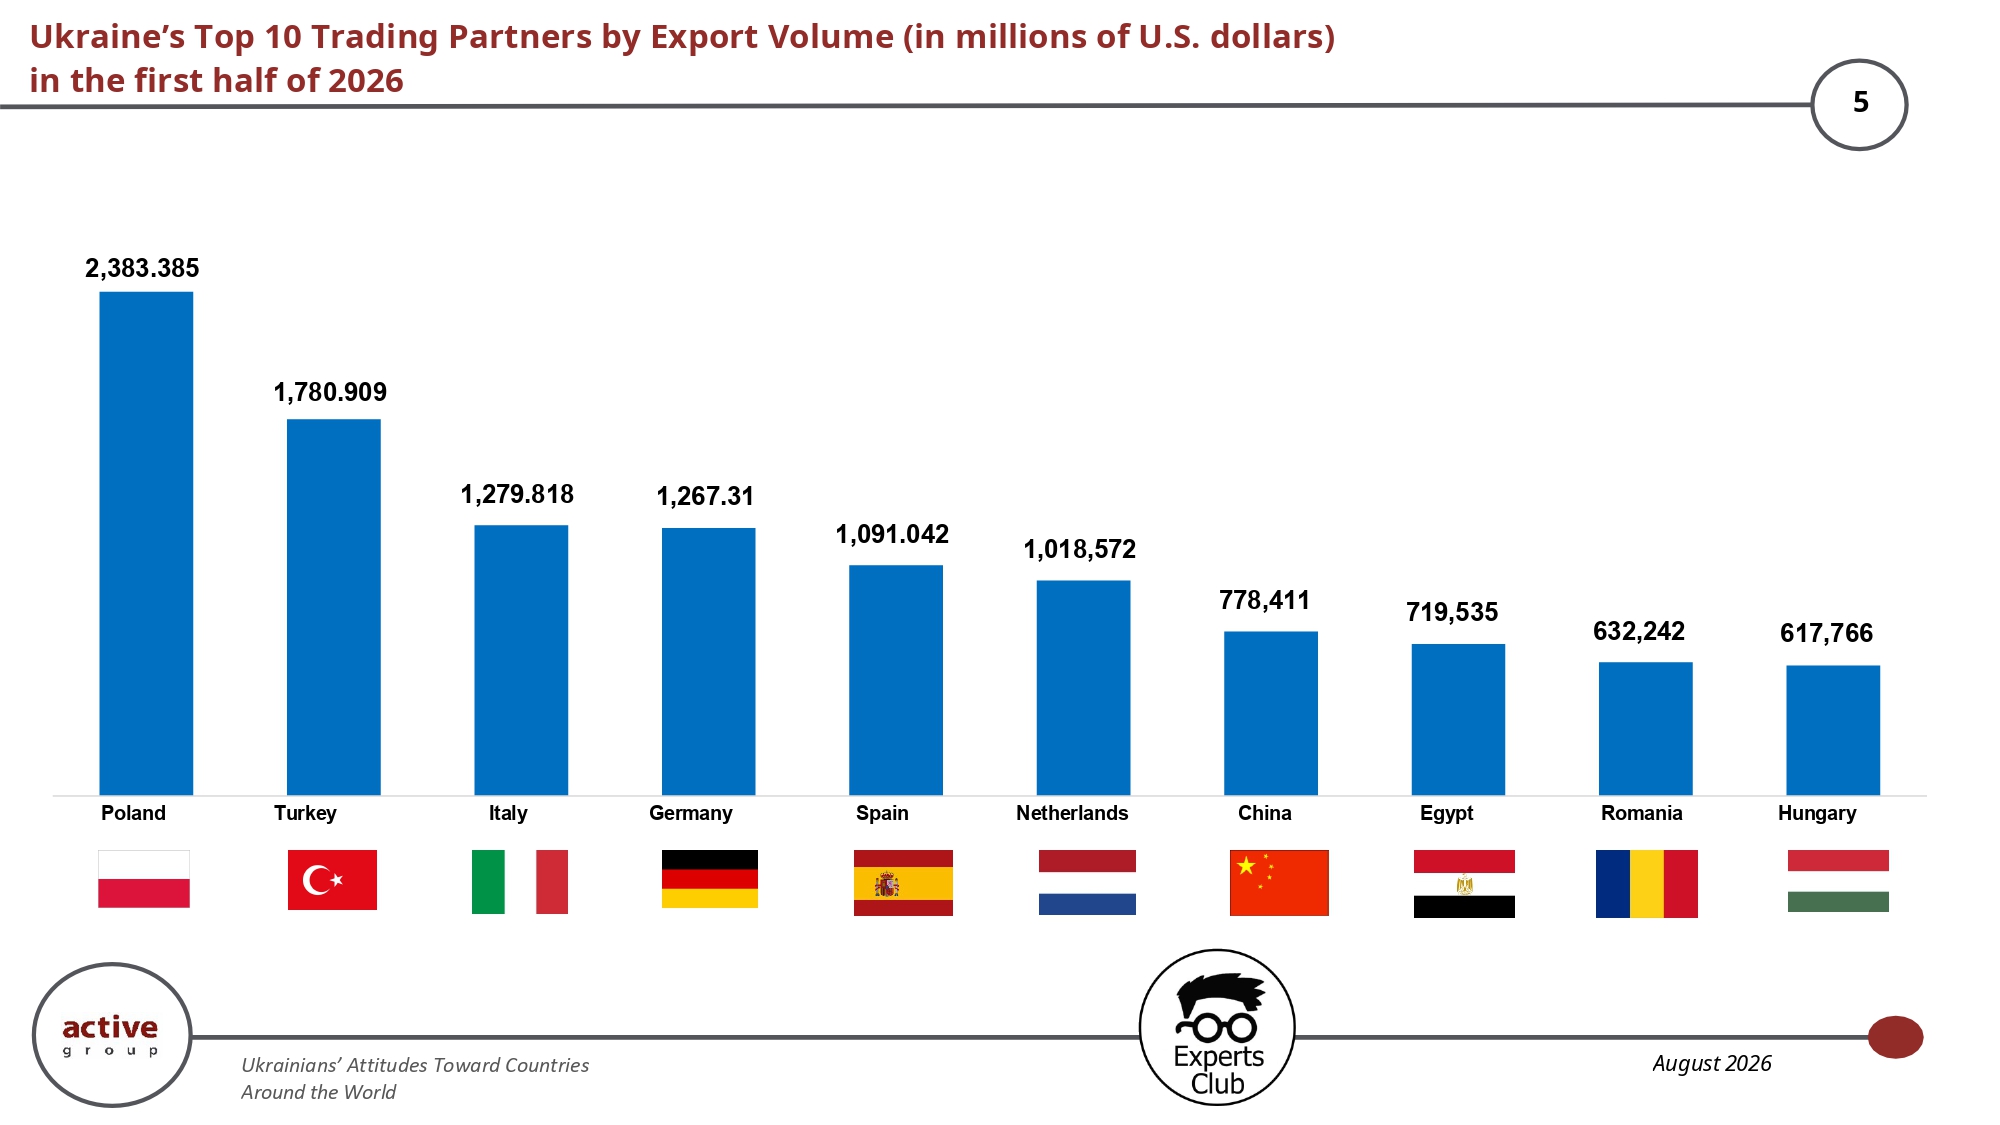
The largest destination for Ukrainian merchandise exports in the first half of 2026 was Poland, at $2.383 billion, followed by Türkiye with $1.781 billion, Italy with $1.280 billion, and Germany with $1.267 billion. Spain, the Netherlands, and China also occupied notable positions. The geography of the top ten shows the predominant orientation of exports toward European markets, although Türkiye, China, and Egypt remain important. Thus, Europe continues to play a central role in the sale of Ukrainian products.
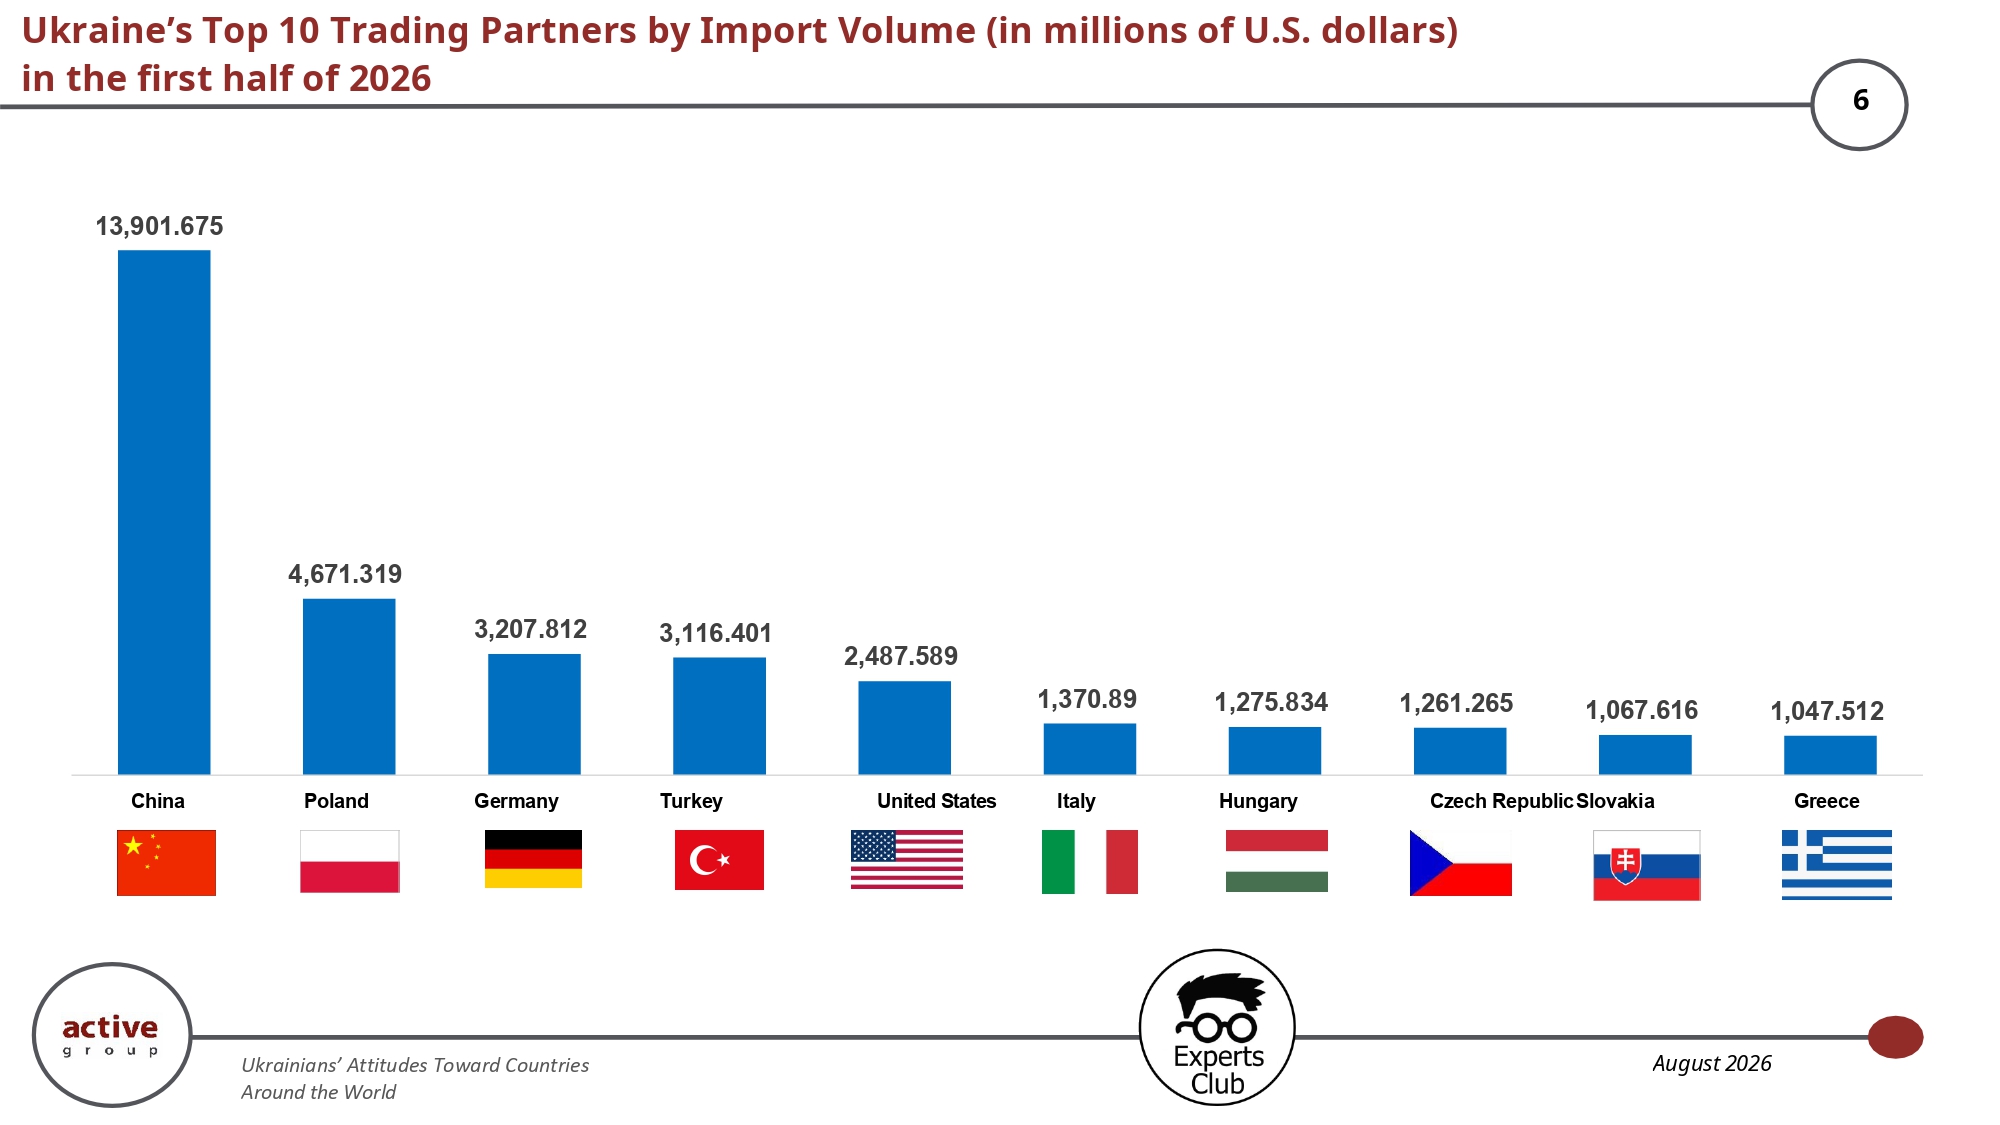
Imports are much more heavily concentrated around one partner: goods worth $13.902 billion were imported from China in the first half of the year, while Poland, which ranks second, accounted for $4.671 billion. Germany, Türkiye, and the United States follow. Such a large gap between China and other suppliers demonstrates the high dependence of Ukraine’s domestic market on Chinese industrial, technological, and consumer goods and, at the same time, is the main reason for the substantial bilateral trade deficit.
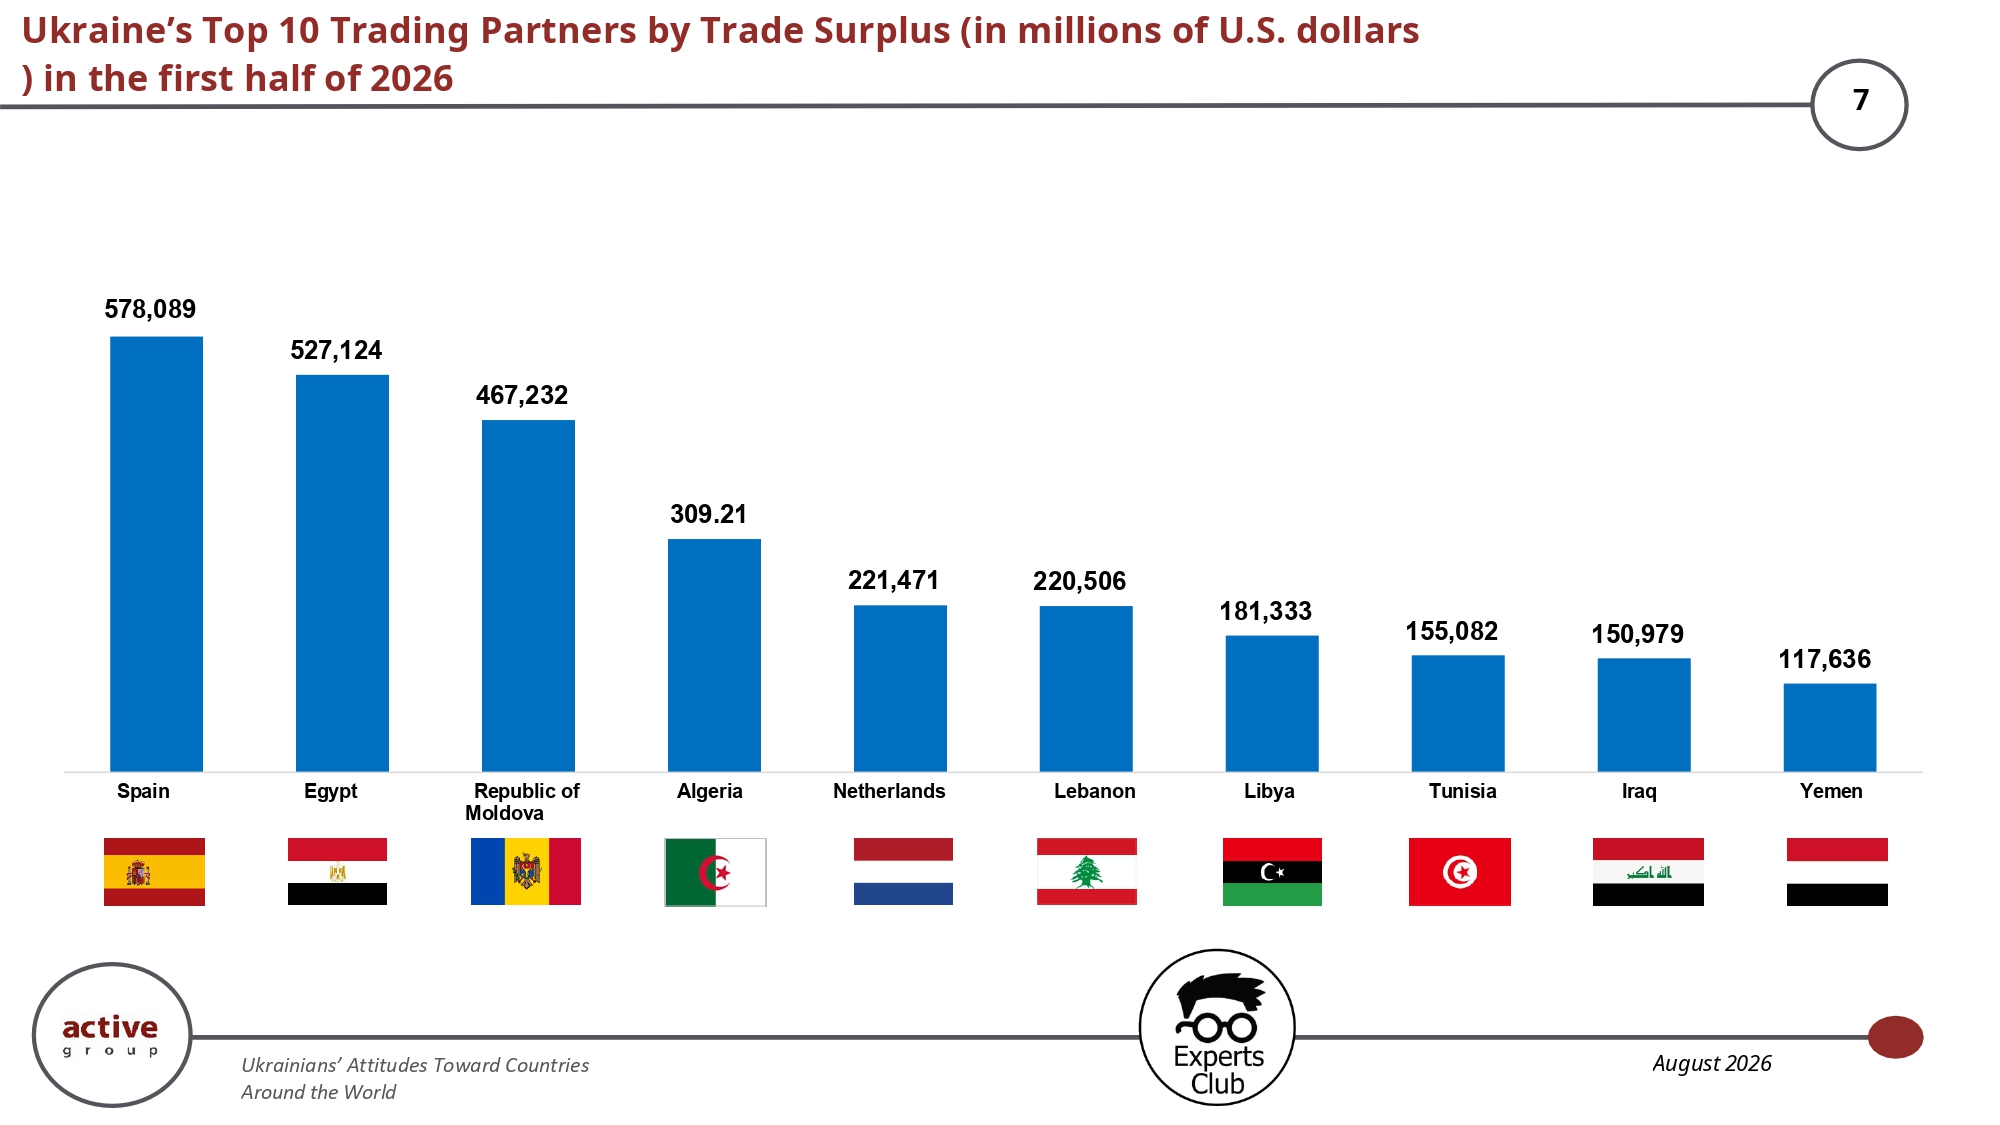
Ukraine recorded its largest positive balance in trade with Spain, at $578 million, Egypt, at $527 million, and Moldova, at $467 million. The top ten also included Algeria, the Netherlands, Lebanon, Libya, Tunisia, Iraq, and Yemen. It is notable that a significant share of the countries with which Ukraine has a surplus are not among its largest partners by total trade turnover. This indicates that not only the largest economies, but also markets where Ukrainian exports structurally exceed imports, may be important for supporting the foreign trade balance.
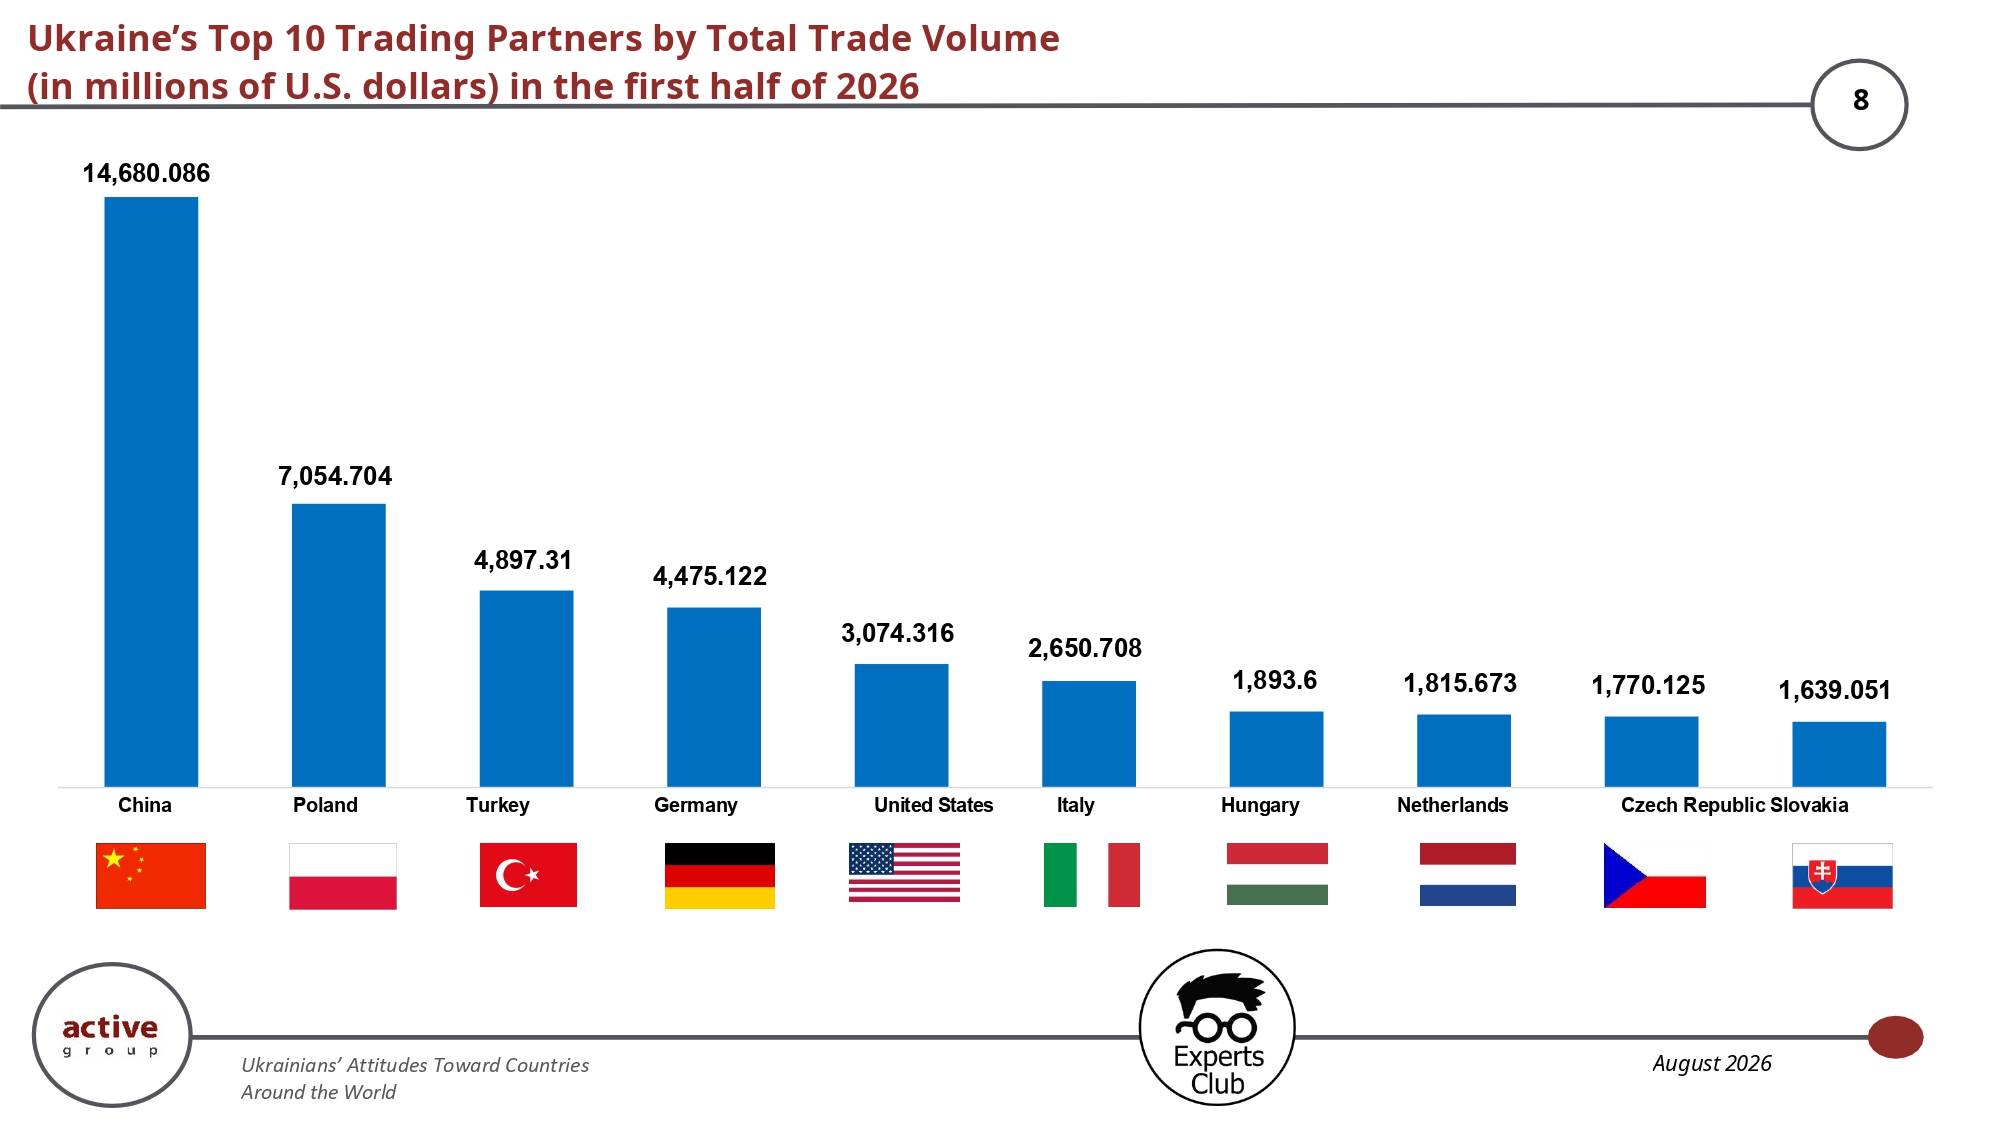
By total trade volume, China, with $14.68 billion, is more than twice as large as Poland, with $7.055 billion. The next positions are occupied by Türkiye, Germany, the United States, and Italy, after which trade volumes no longer exceed $2 billion. This structure means that Ukraine’s foreign trade is geographically diversified, but its upper segment remains highly concentrated. Particularly important is the fact that the largest partner simultaneously generates the largest bilateral deficit.
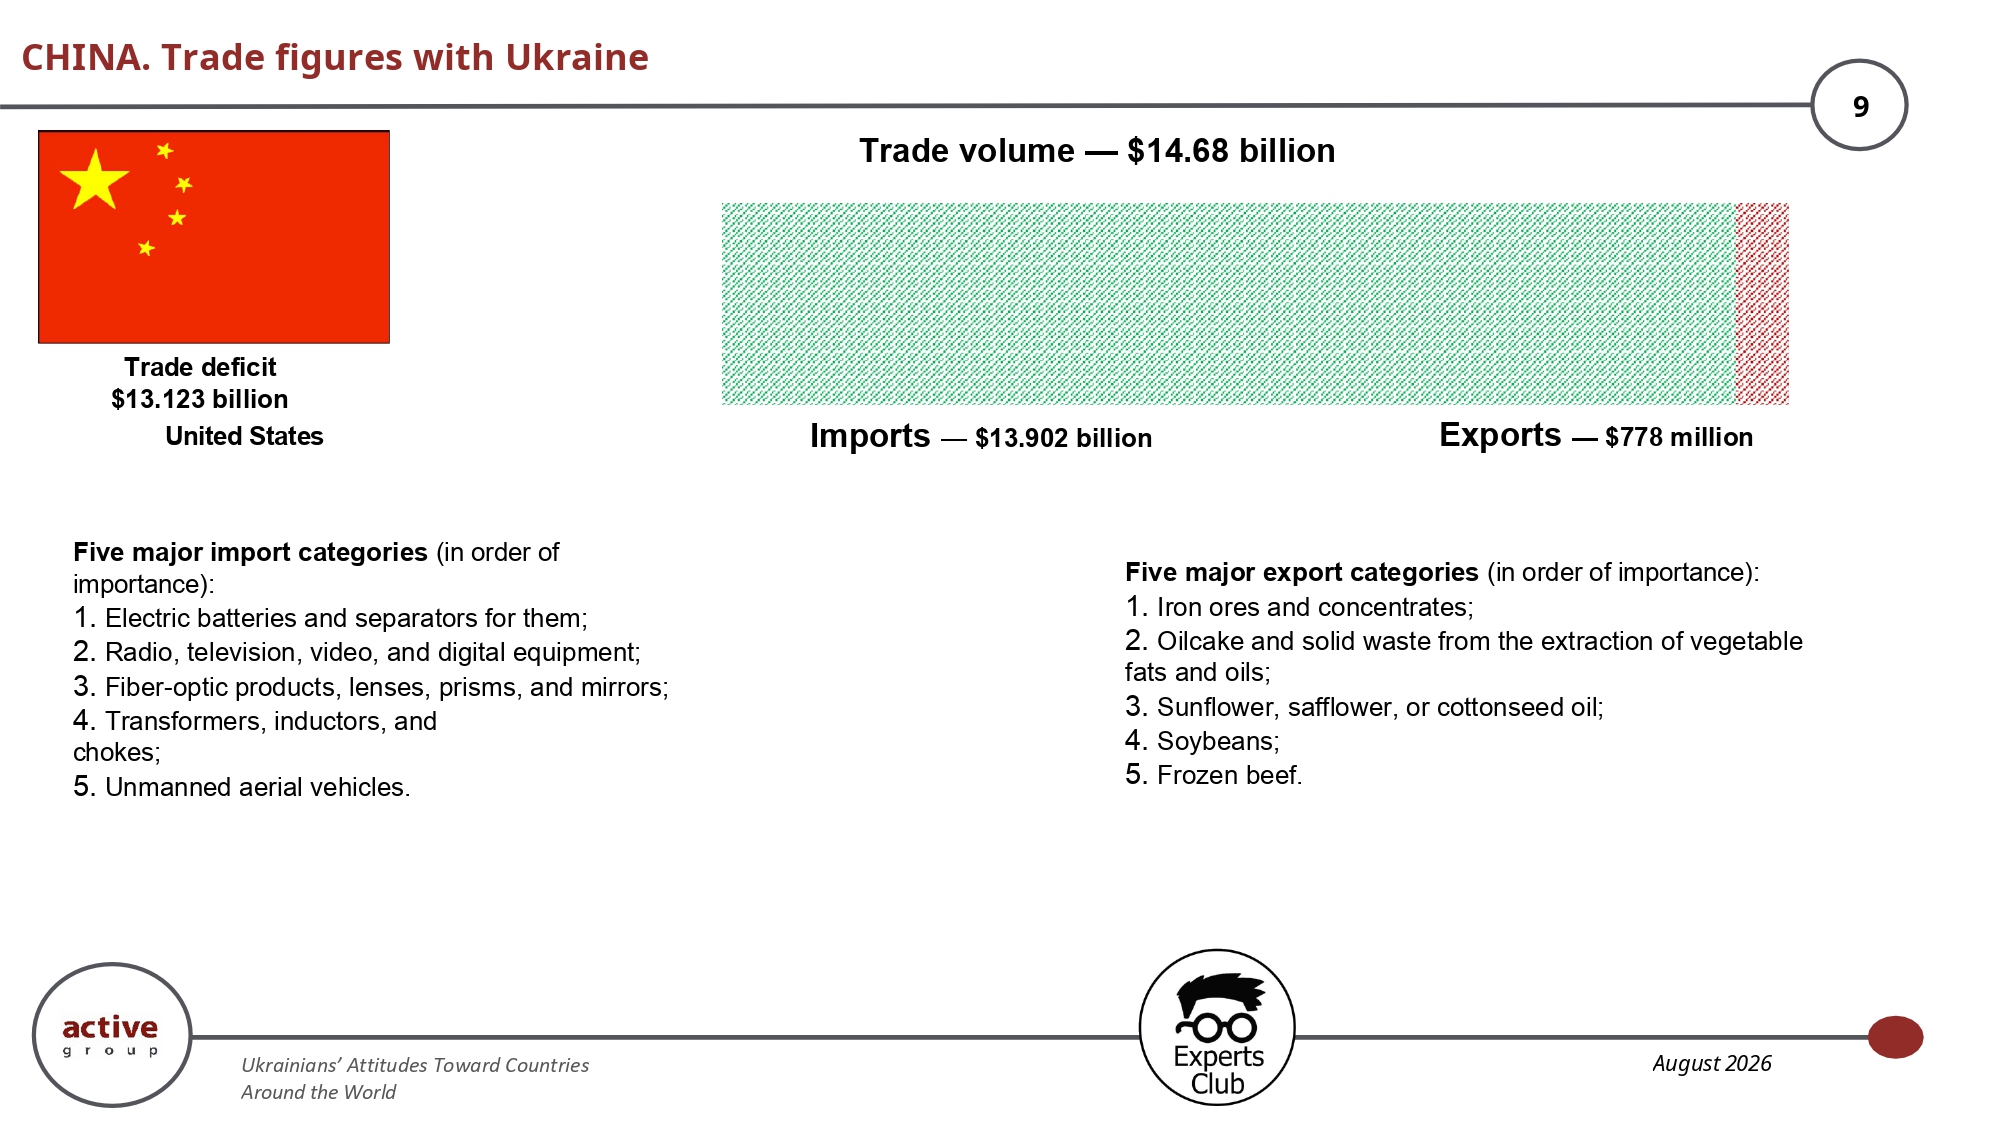
China is Ukraine’s largest trading partner, but the nature of this trade is sharply asymmetric: with imports of almost $13.9 billion, Ukrainian exports amount to only about $778 million, while the negative balance exceeds $13.1 billion. Ukraine sells China mainly iron ore, products from the processing of oilseeds, vegetable oils, soybeans, and meat, while importing batteries, electronics, optical products, transformers, and unmanned aerial vehicles. This clearly demonstrates the difference between the raw-material and agricultural structure of Ukrainian exports and the more technologically sophisticated structure of Chinese supplies.
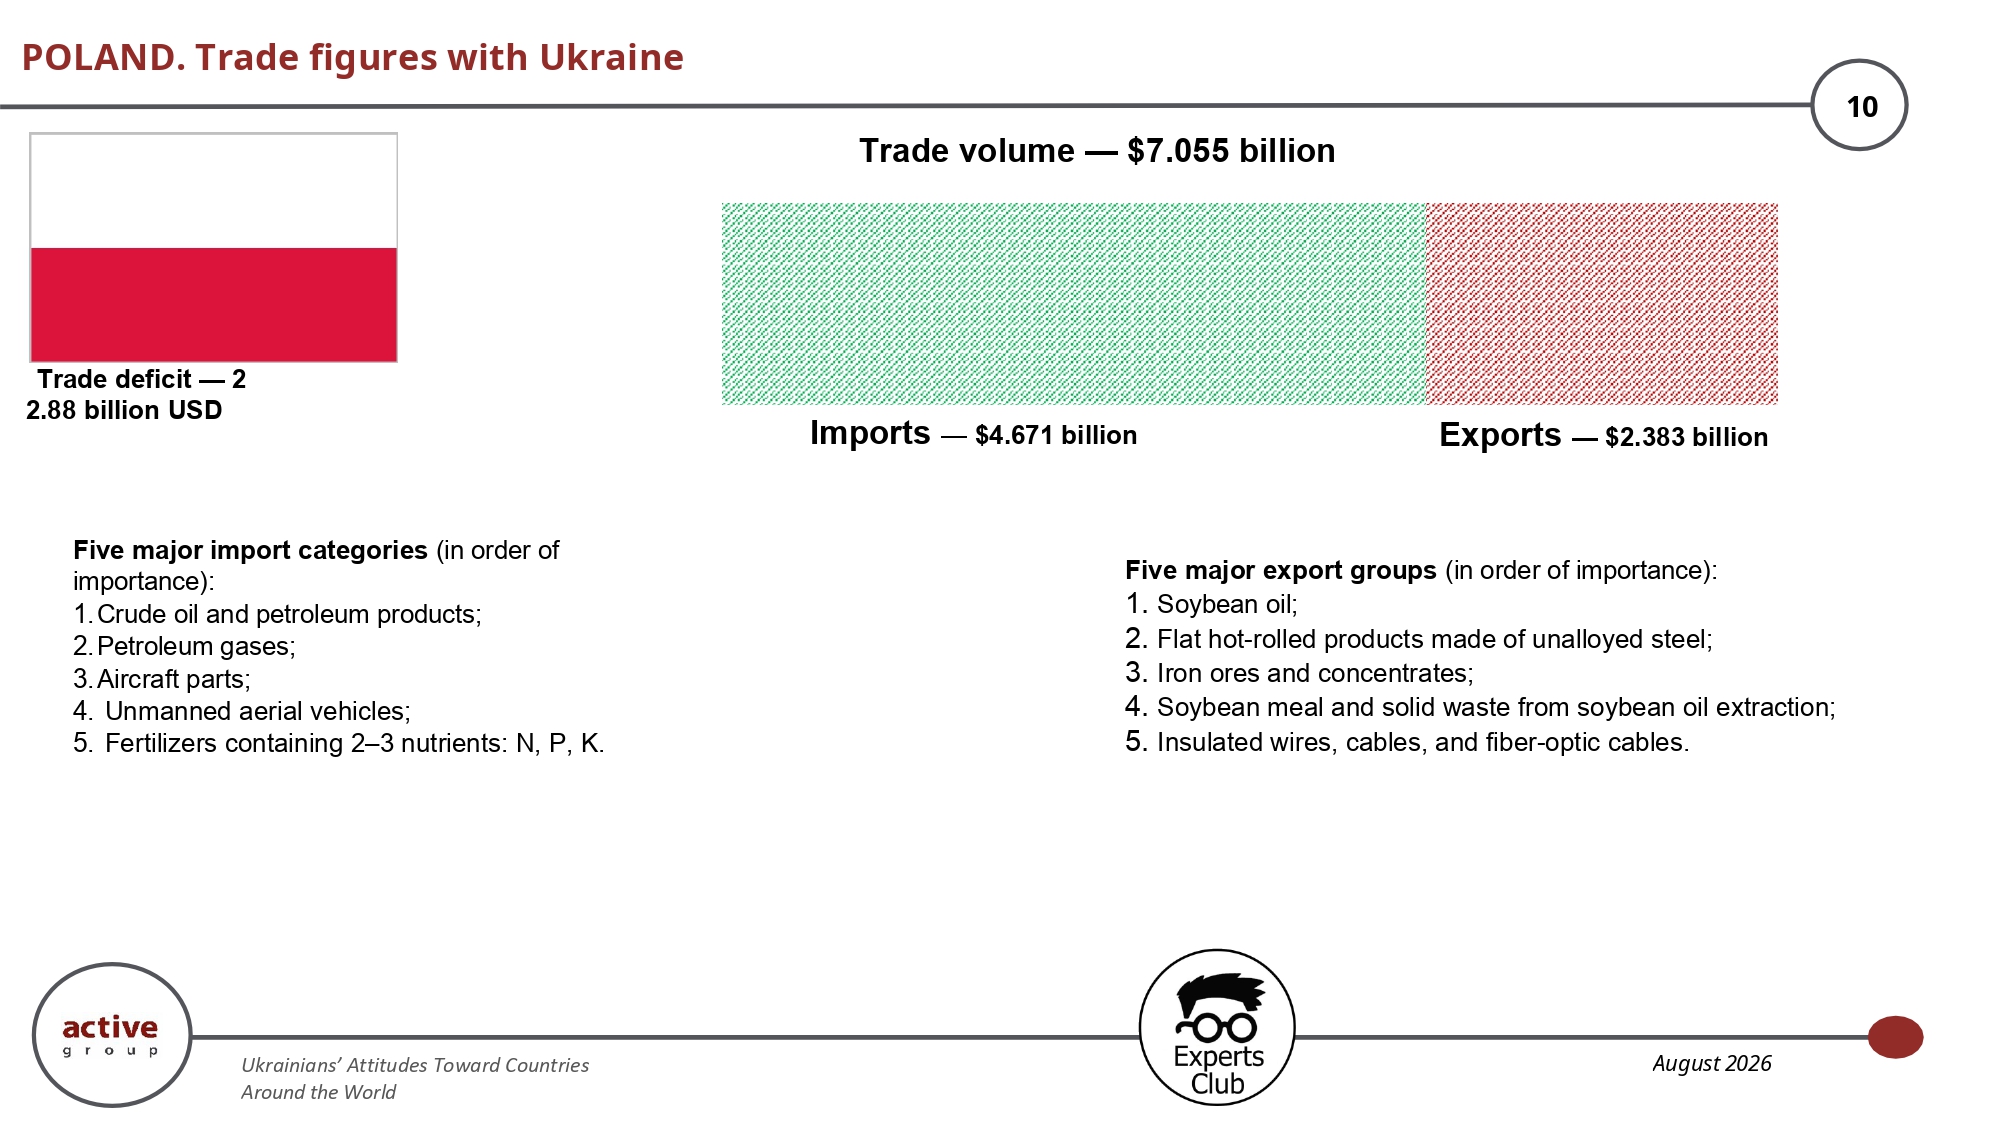
Poland is Ukraine’s second-largest trading partner, with trade turnover of about $7.06 billion, and at the same time the largest individual market for Ukrainian exports, at $2.383 billion. However, imports from Poland are almost twice as high and amount to $4.671 billion, creating a deficit of approximately $2.29 billion. Ukrainian exports include soybean oil, metal products, iron ore, and cable products, while supplies from Poland prominently include petroleum products, gases, aircraft components, UAVs, and fertilizers.
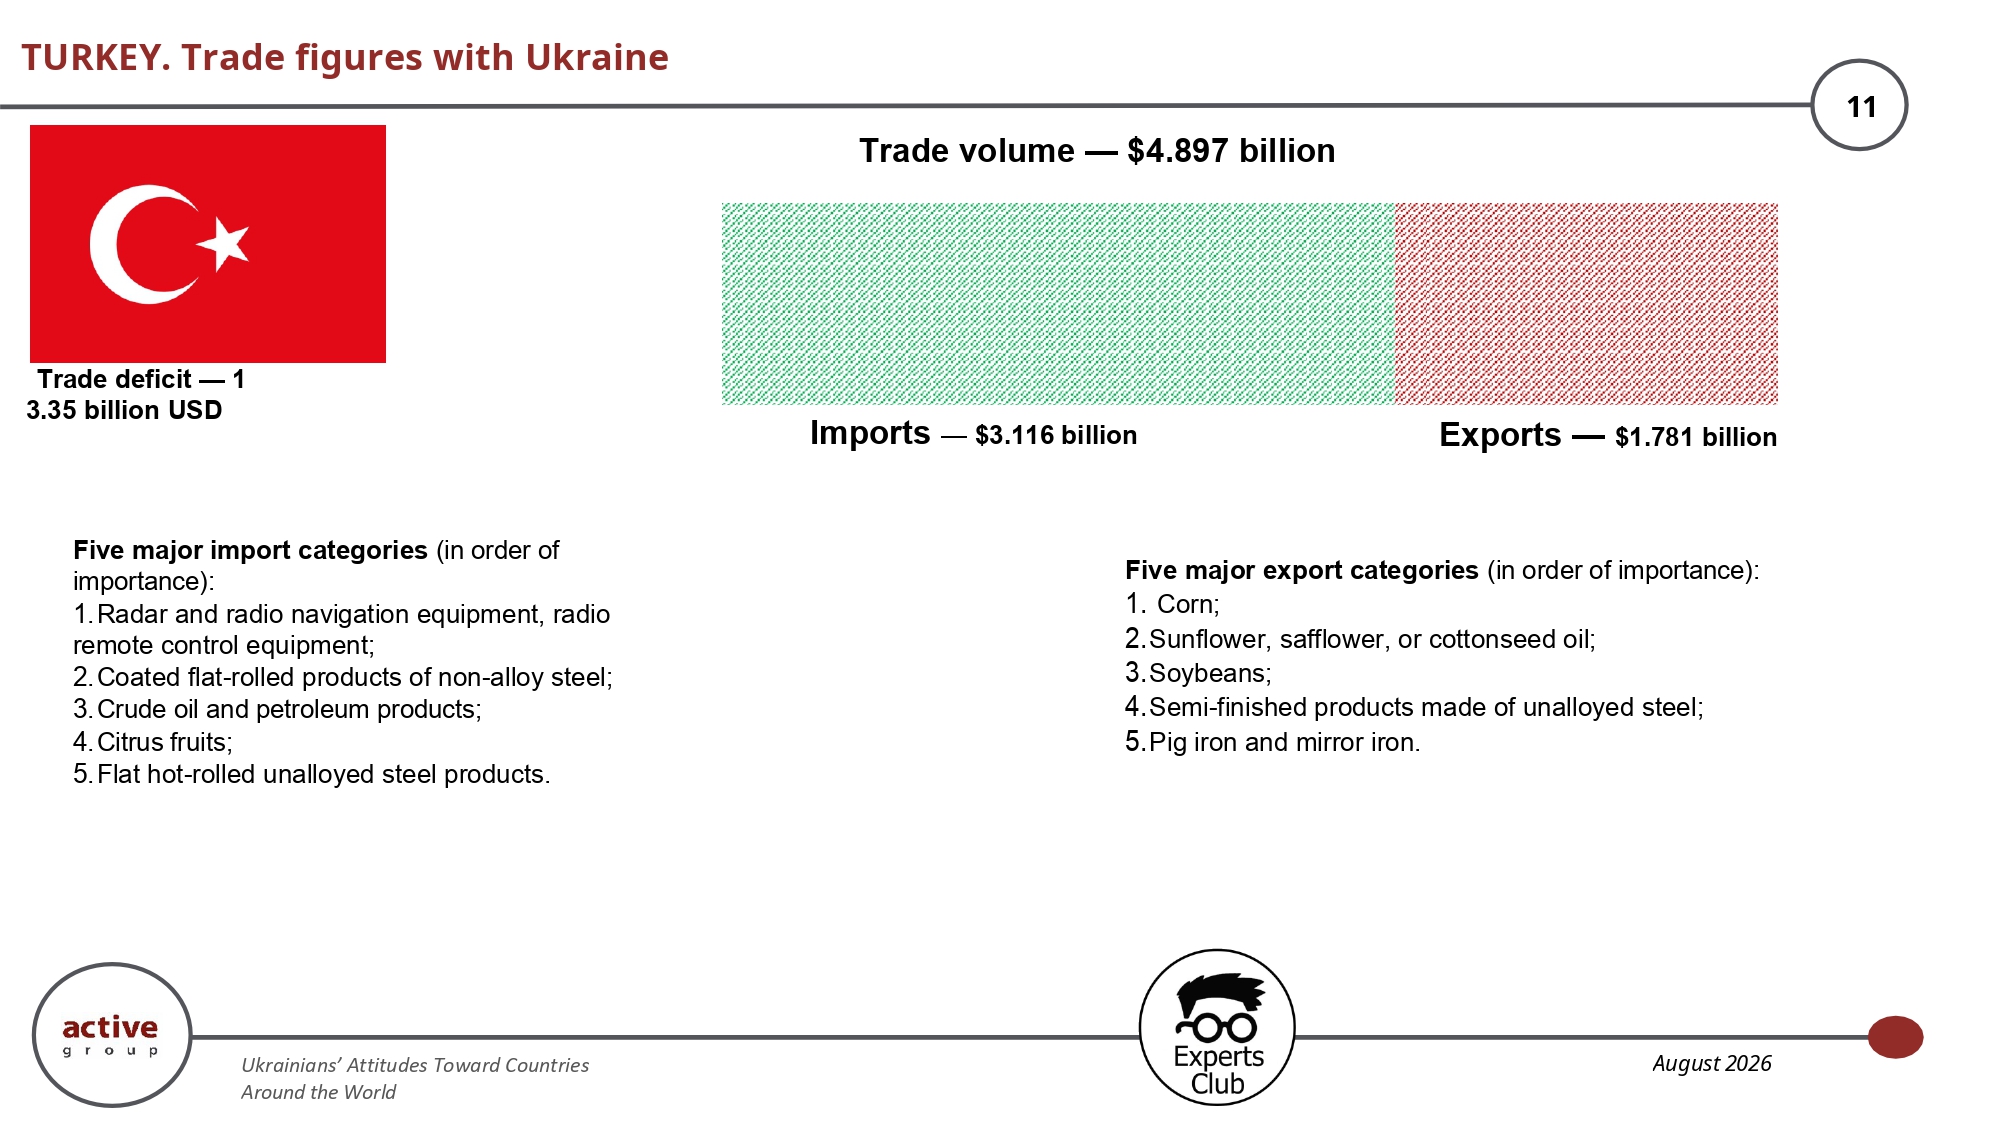
Ukraine’s trade turnover with Türkiye approached $4.9 billion, but imports of $3.116 billion significantly exceeded exports of $1.781 billion, creating a deficit of approximately $1.34 billion. Ukraine supplies the Turkish market primarily with corn, vegetable oils, soybeans, metal semi-finished products, and pig iron. In the opposite direction come radar and radio navigation equipment, rolled metal products, petroleum products, and citrus fruits. Thus, Türkiye remains both an important market for Ukrainian agricultural and metallurgical products and a major supplier of industrial goods.
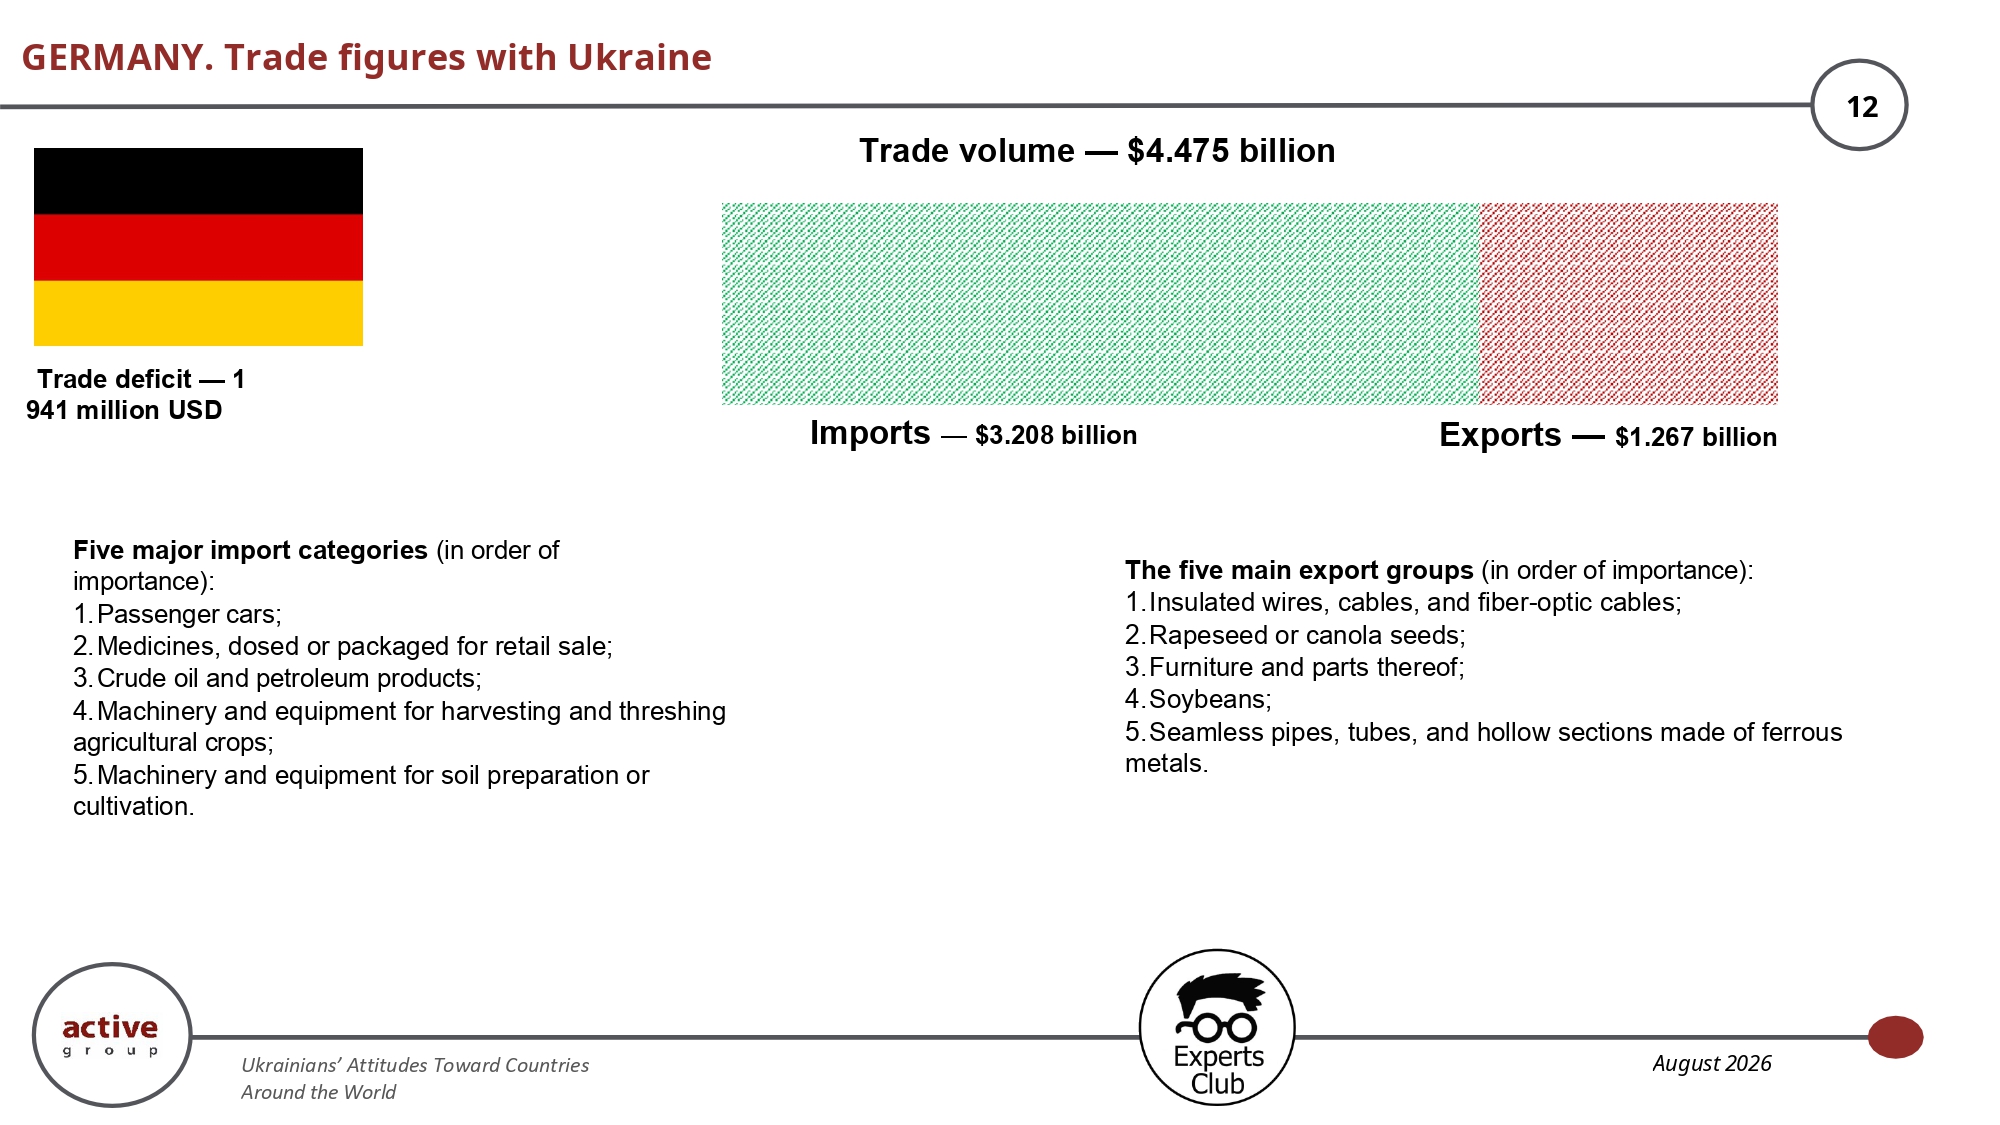
Trade with Germany is also characterized by a significant deficit: with exports of about $1.267 billion, imports amount to $3.208 billion. Ukraine exports mainly cable products, rapeseed, furniture, soybeans, and metal pipes, while the key German import items are passenger cars, medicines, petroleum products, and agricultural machinery. This structure clearly reflects the difference in the technological complexity of mutual supplies and explains the persistent predominance of German exports in bilateral trade turnover.
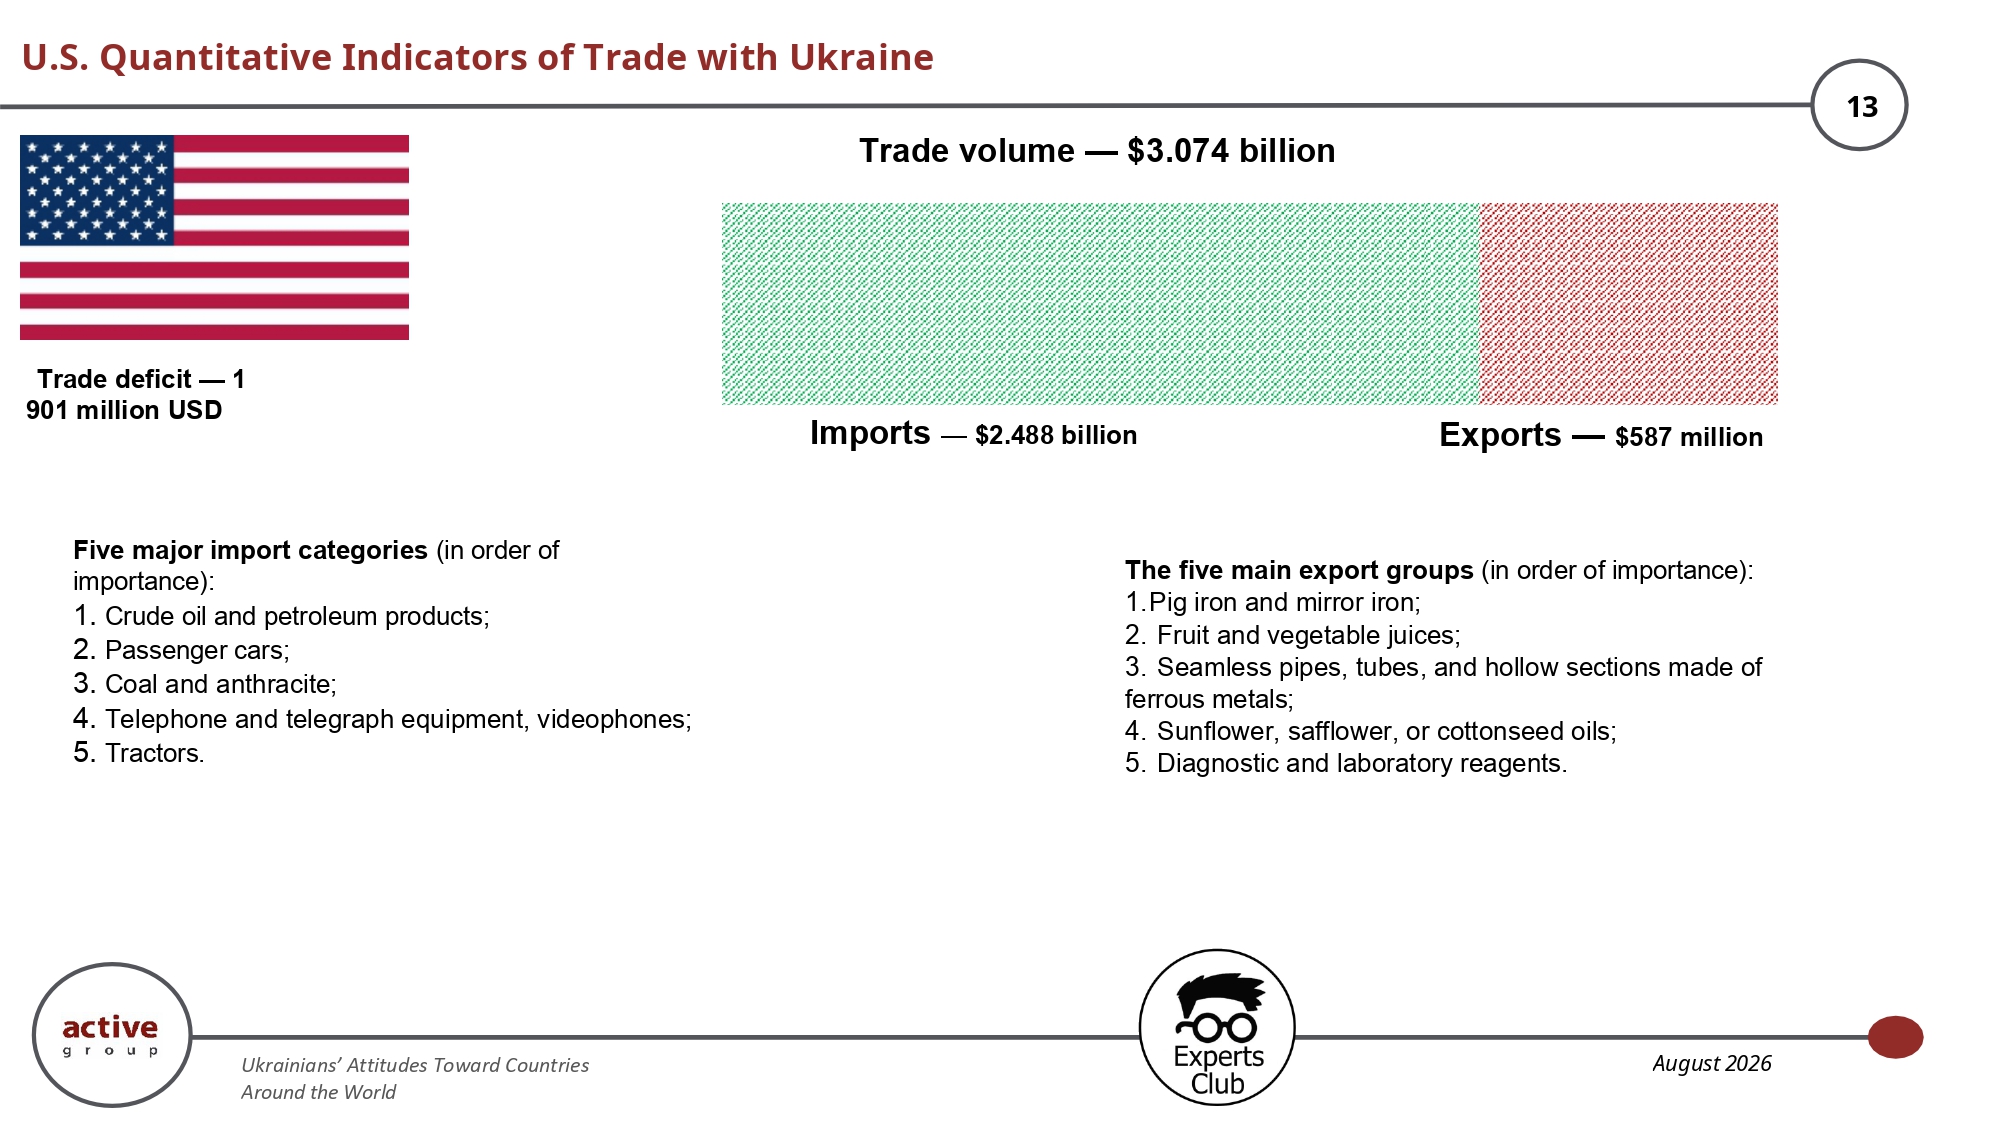
Ukraine’s trade turnover with the United States amounted to about $3.07 billion, of which nearly $2.49 billion represented U.S. imports and only $587 million Ukrainian exports. As a result, the deficit exceeded $1.9 billion. Ukraine supplies the United States with pig iron, juices, metal pipes, vegetable oils, and laboratory reagents, while importing petroleum products, cars, coal, telecommunications equipment, and tractors. Bilateral trade therefore remains important, but its structure is significantly shifted in favor of U.S. exports.
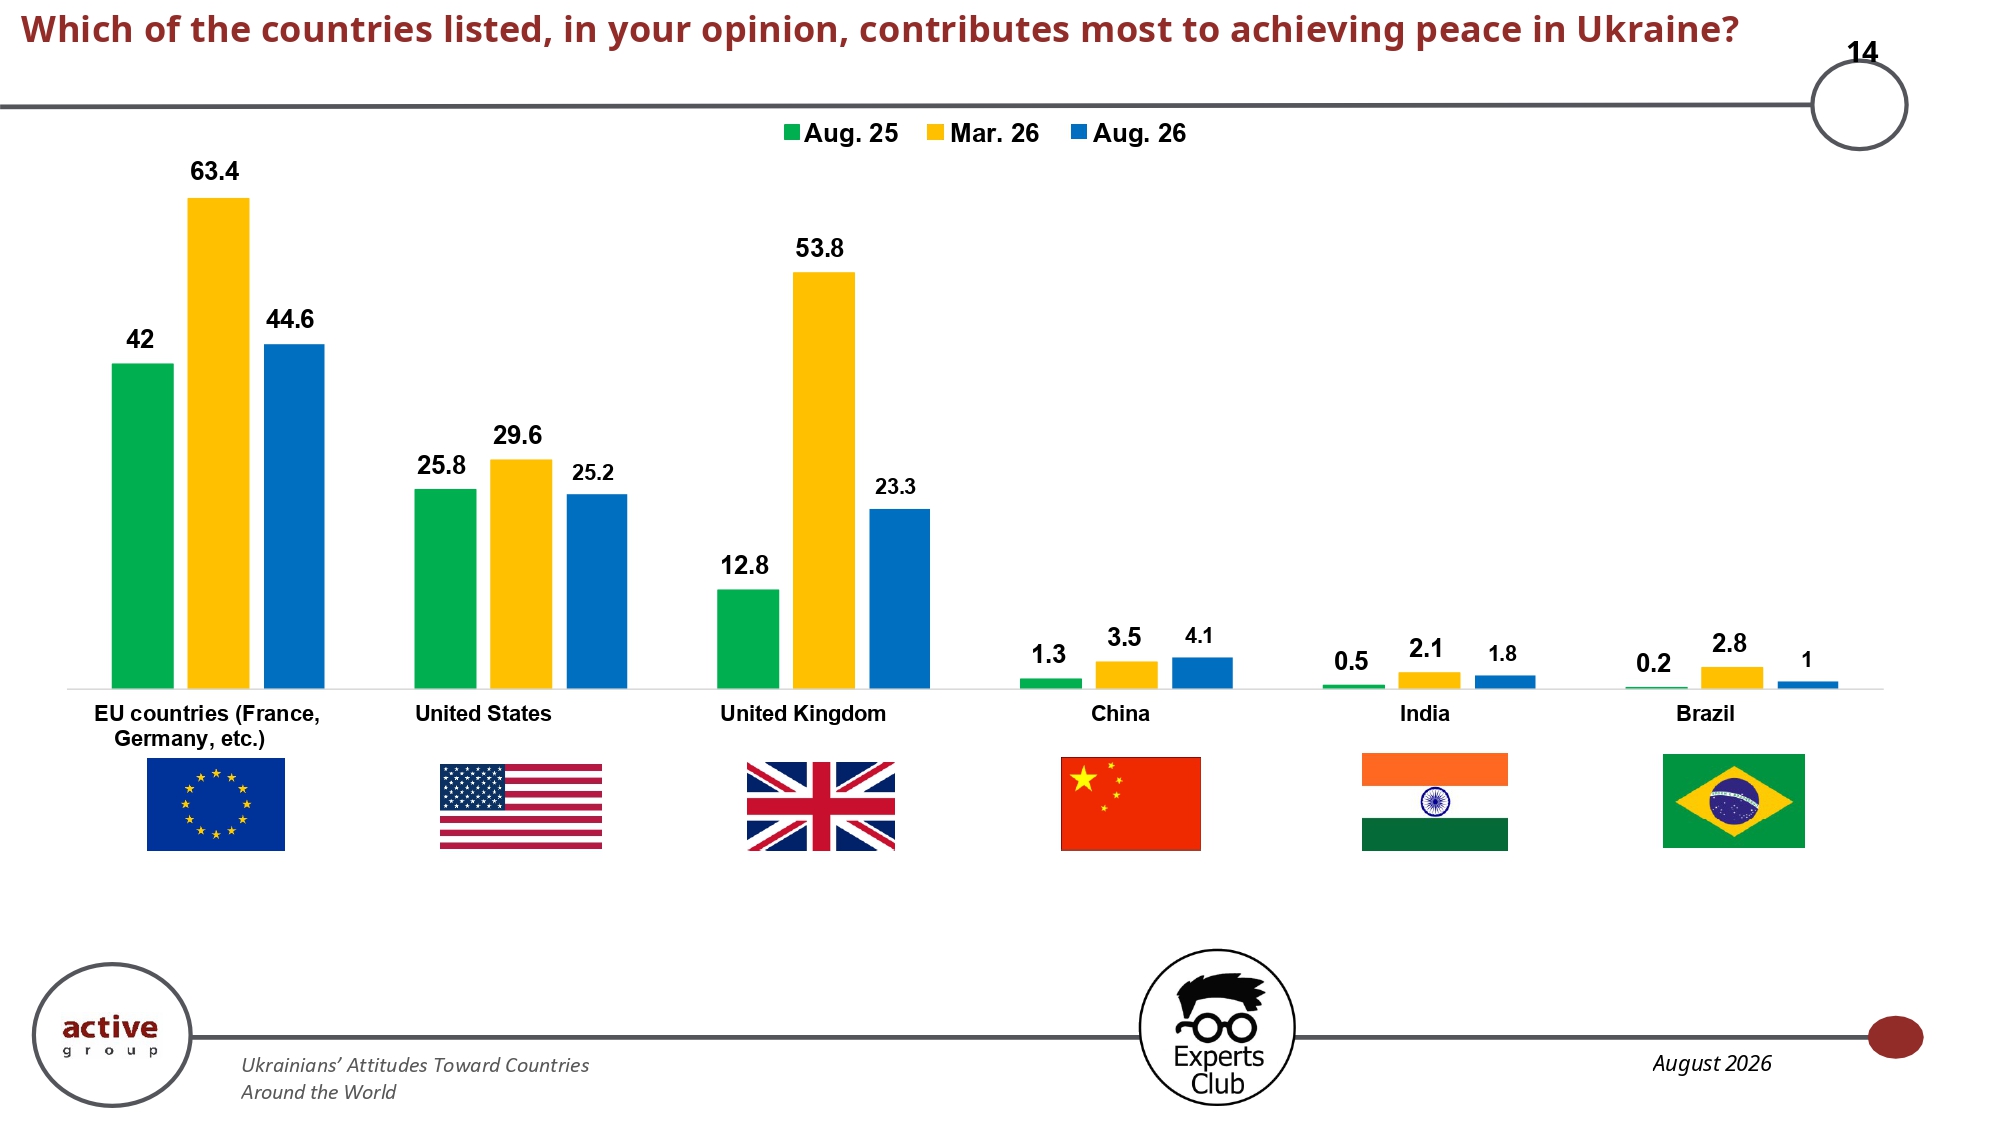
In August 2026, 44.6% of respondents named EU countries as making the greatest contribution to achieving peace in Ukraine, 25.2% named the United States, and 23.3% named the United Kingdom. The figures for China, India, and Brazil remain in the single digits — 4.1%, 1.8%, and 1%, respectively. Compared with March, assessments of the role of the EU and especially the United Kingdom declined noticeably, but Western countries taken together continue to overwhelmingly dominate public perceptions of potential contributions to a peace settlement.
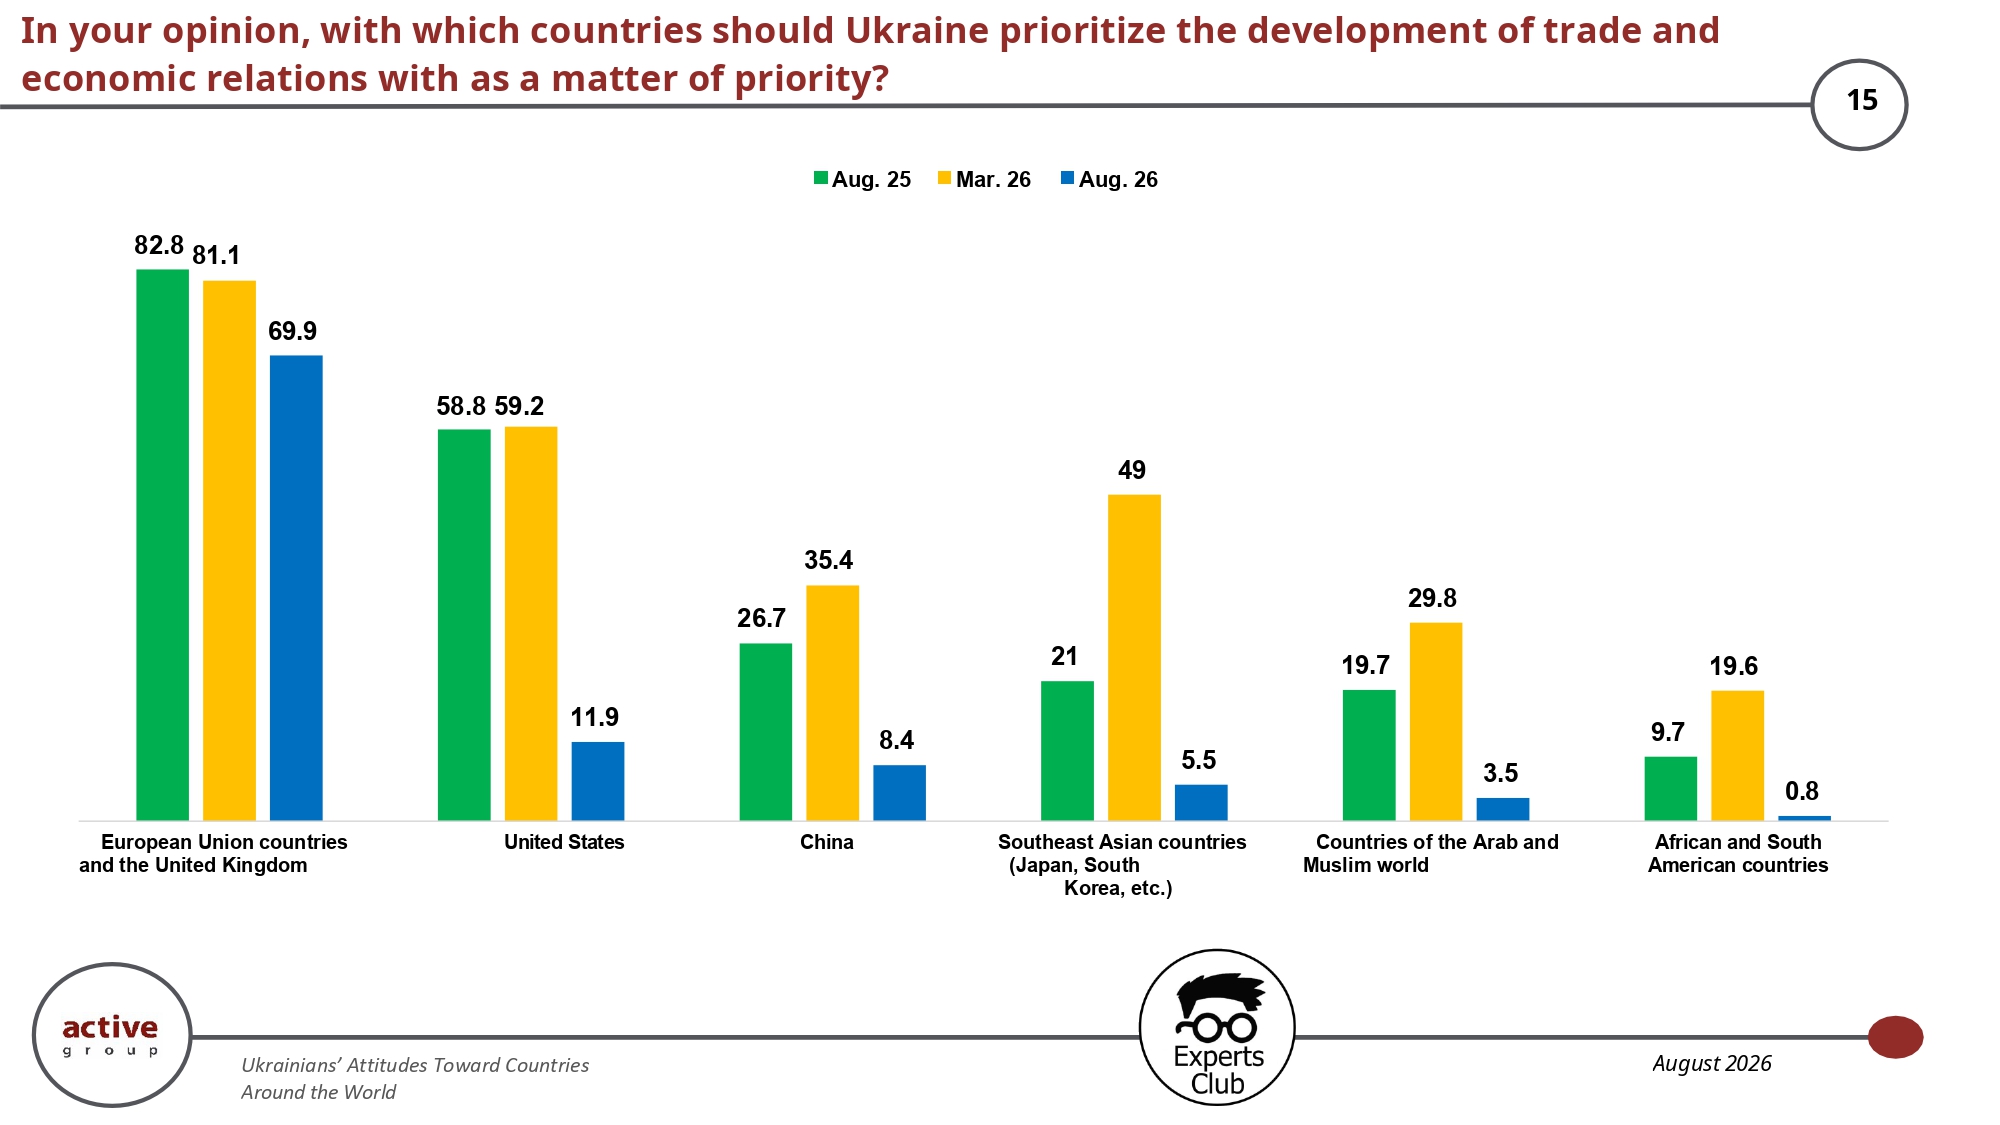
The countries of the European Union and the United Kingdom remain the undisputed top priority for the development of trade and economic relations — in August they were named by 69.9% of respondents. Significantly lower figures were recorded for the United States — 11.9%, China — 8.4%, Southeast Asian countries — 5.5%, countries of the Arab and Muslim world — 3.5%, and African and South American countries — only 0.8%. Thus, public expectations regarding Ukraine’s economic geography are extremely strongly concentrated on the European direction.
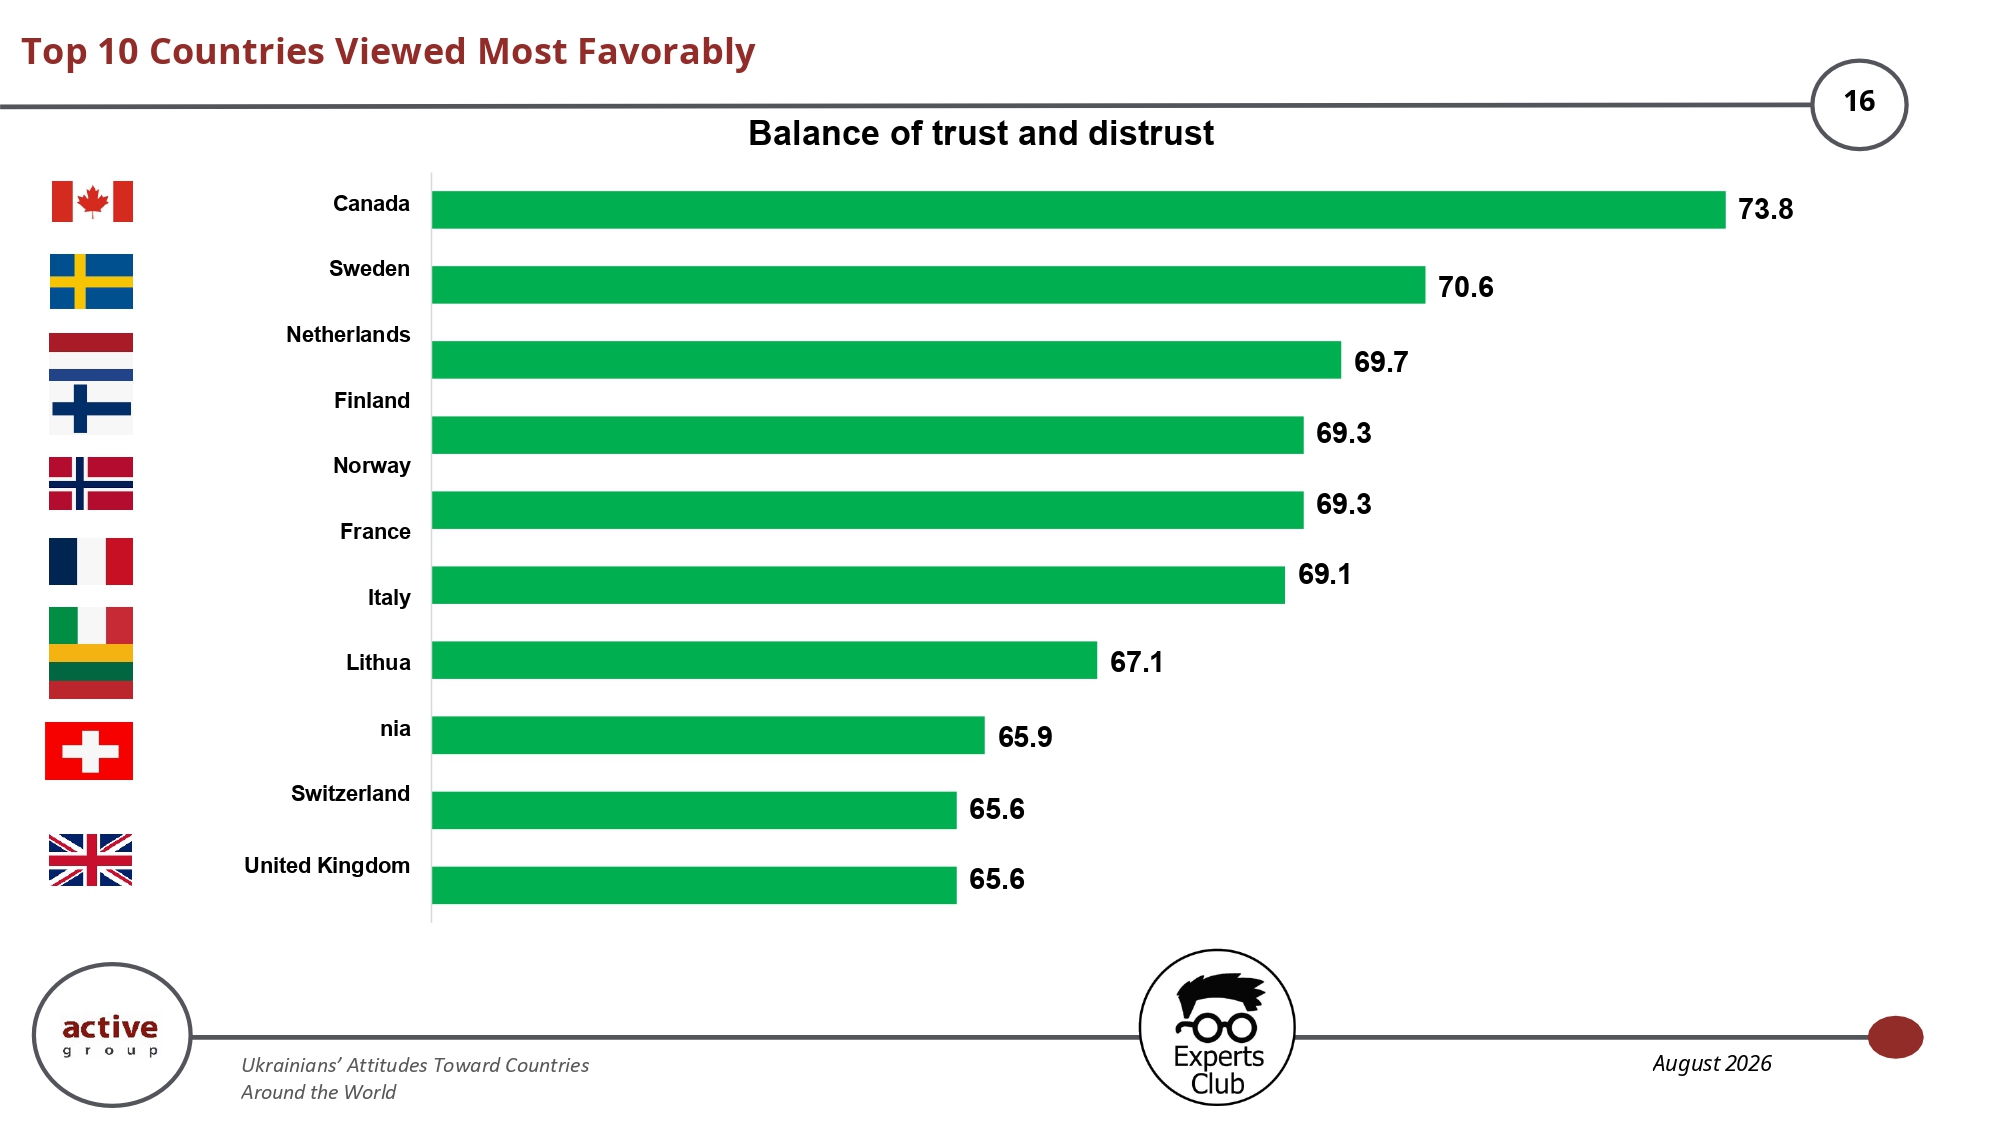
Canada recorded the best balance between positive and negative attitudes among the countries studied, at 73.8 points. It was followed by Sweden, the Netherlands, Finland, Norway, France, Italy, Lithuania, Switzerland, and the United Kingdom. It is notable that the entire top ten consists of Western and Northern European countries and Canada. This indicates a well-established core of countries enjoying a high level of public favor, which largely coincides with Ukrainians’ Western foreign economic and international orientation.
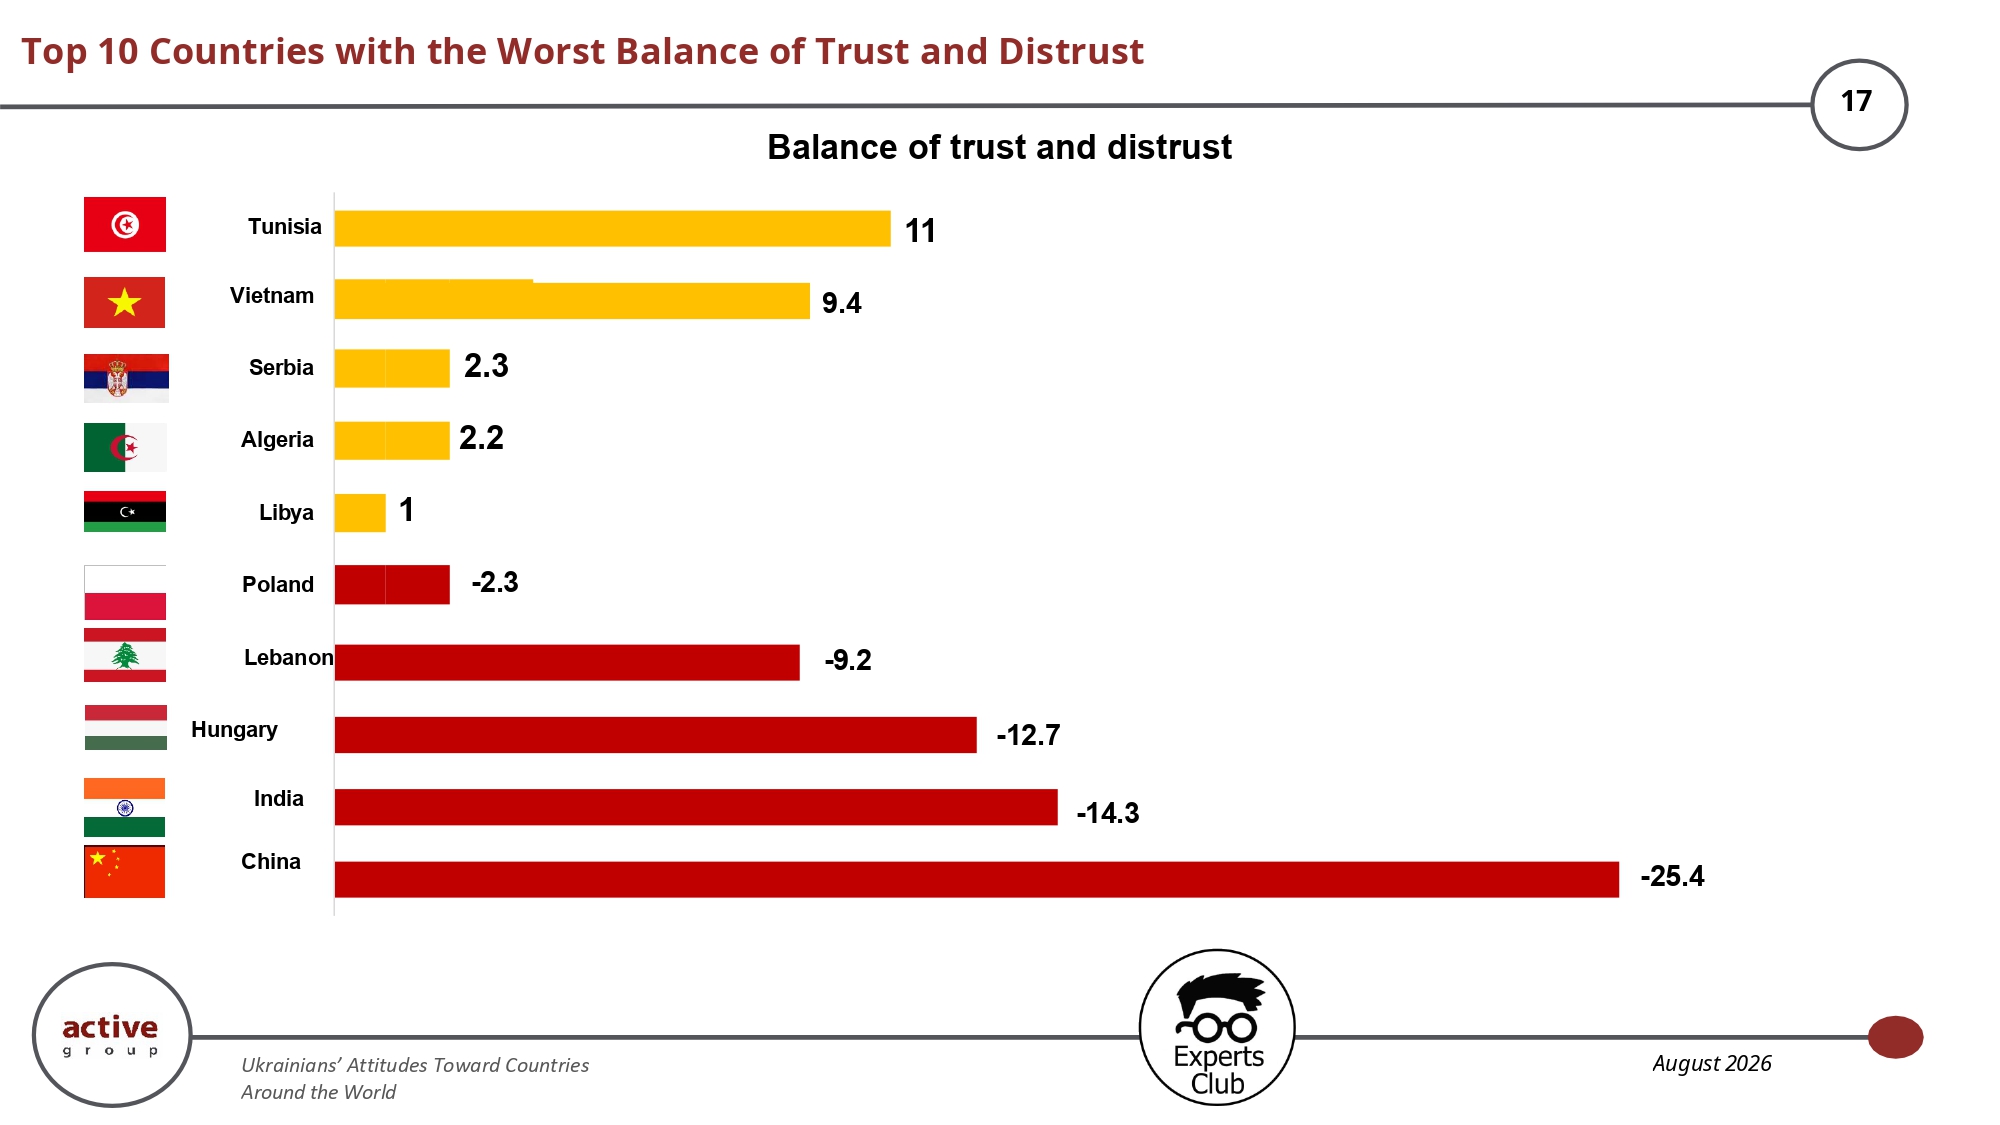
The lowest attitude balance was recorded for China, at minus 25.4 points, India at minus 14.3, and Hungary at minus 12.7. Lebanon and Poland also have a negative balance, while Libya, Algeria, Serbia, Vietnam, and Tunisia remain in the weakly positive zone. China’s presence among the lowest-ranked countries is particularly notable, given that it is simultaneously Ukraine’s largest trading partner. This is one of the clearest examples of a gap between a country’s economic significance and its public perception.
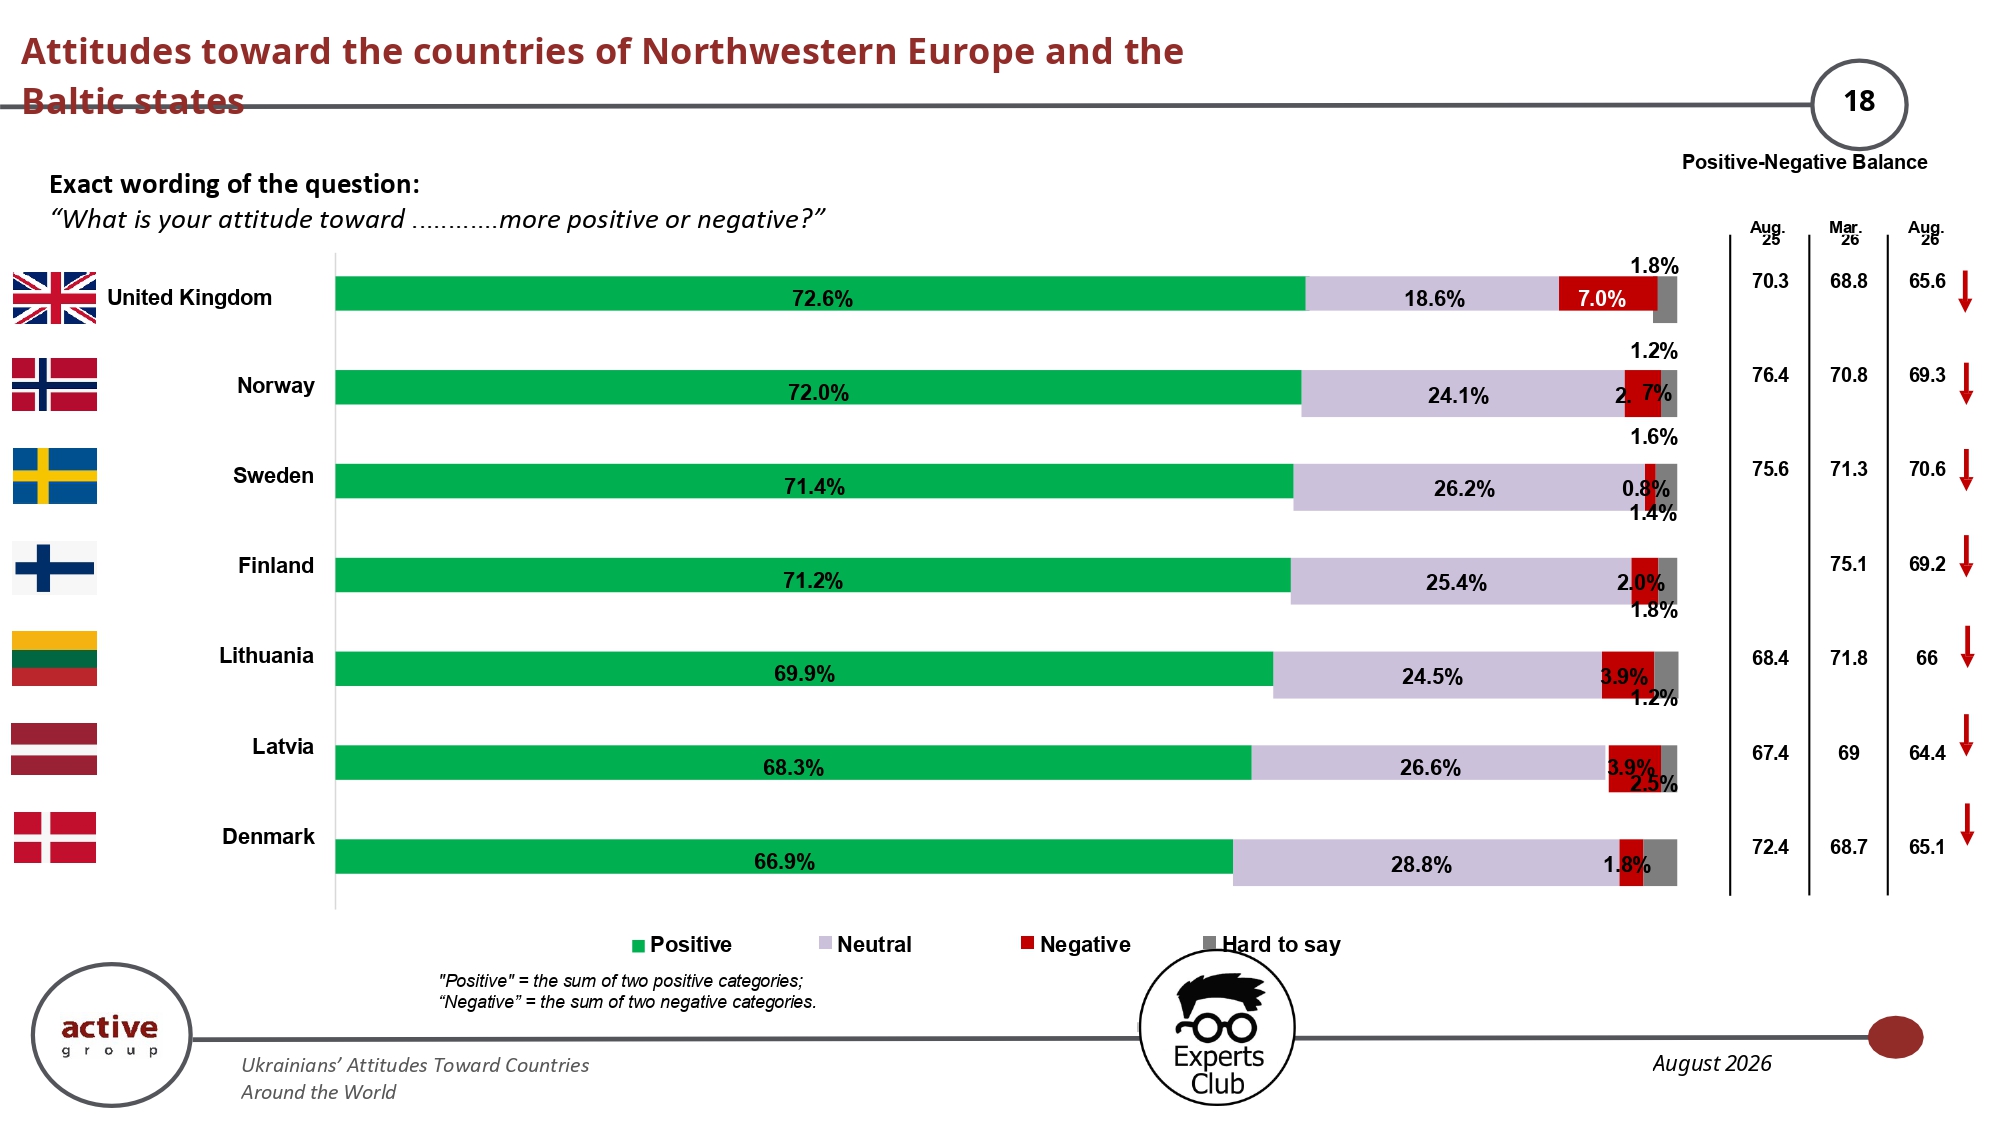
Ukrainians’ attitudes toward the countries of Northwestern Europe and the Baltic states remain predominantly positive: the share of positive assessments for the United Kingdom, Norway, Sweden, Finland, Lithuania, Latvia, and Denmark is approximately 67–73%. Negative assessments in most cases remain at only a few percent. At the same time, changes in the balance compared with previous waves are not identical across countries: some show a certain decline, but the overall level of favor remains very high.
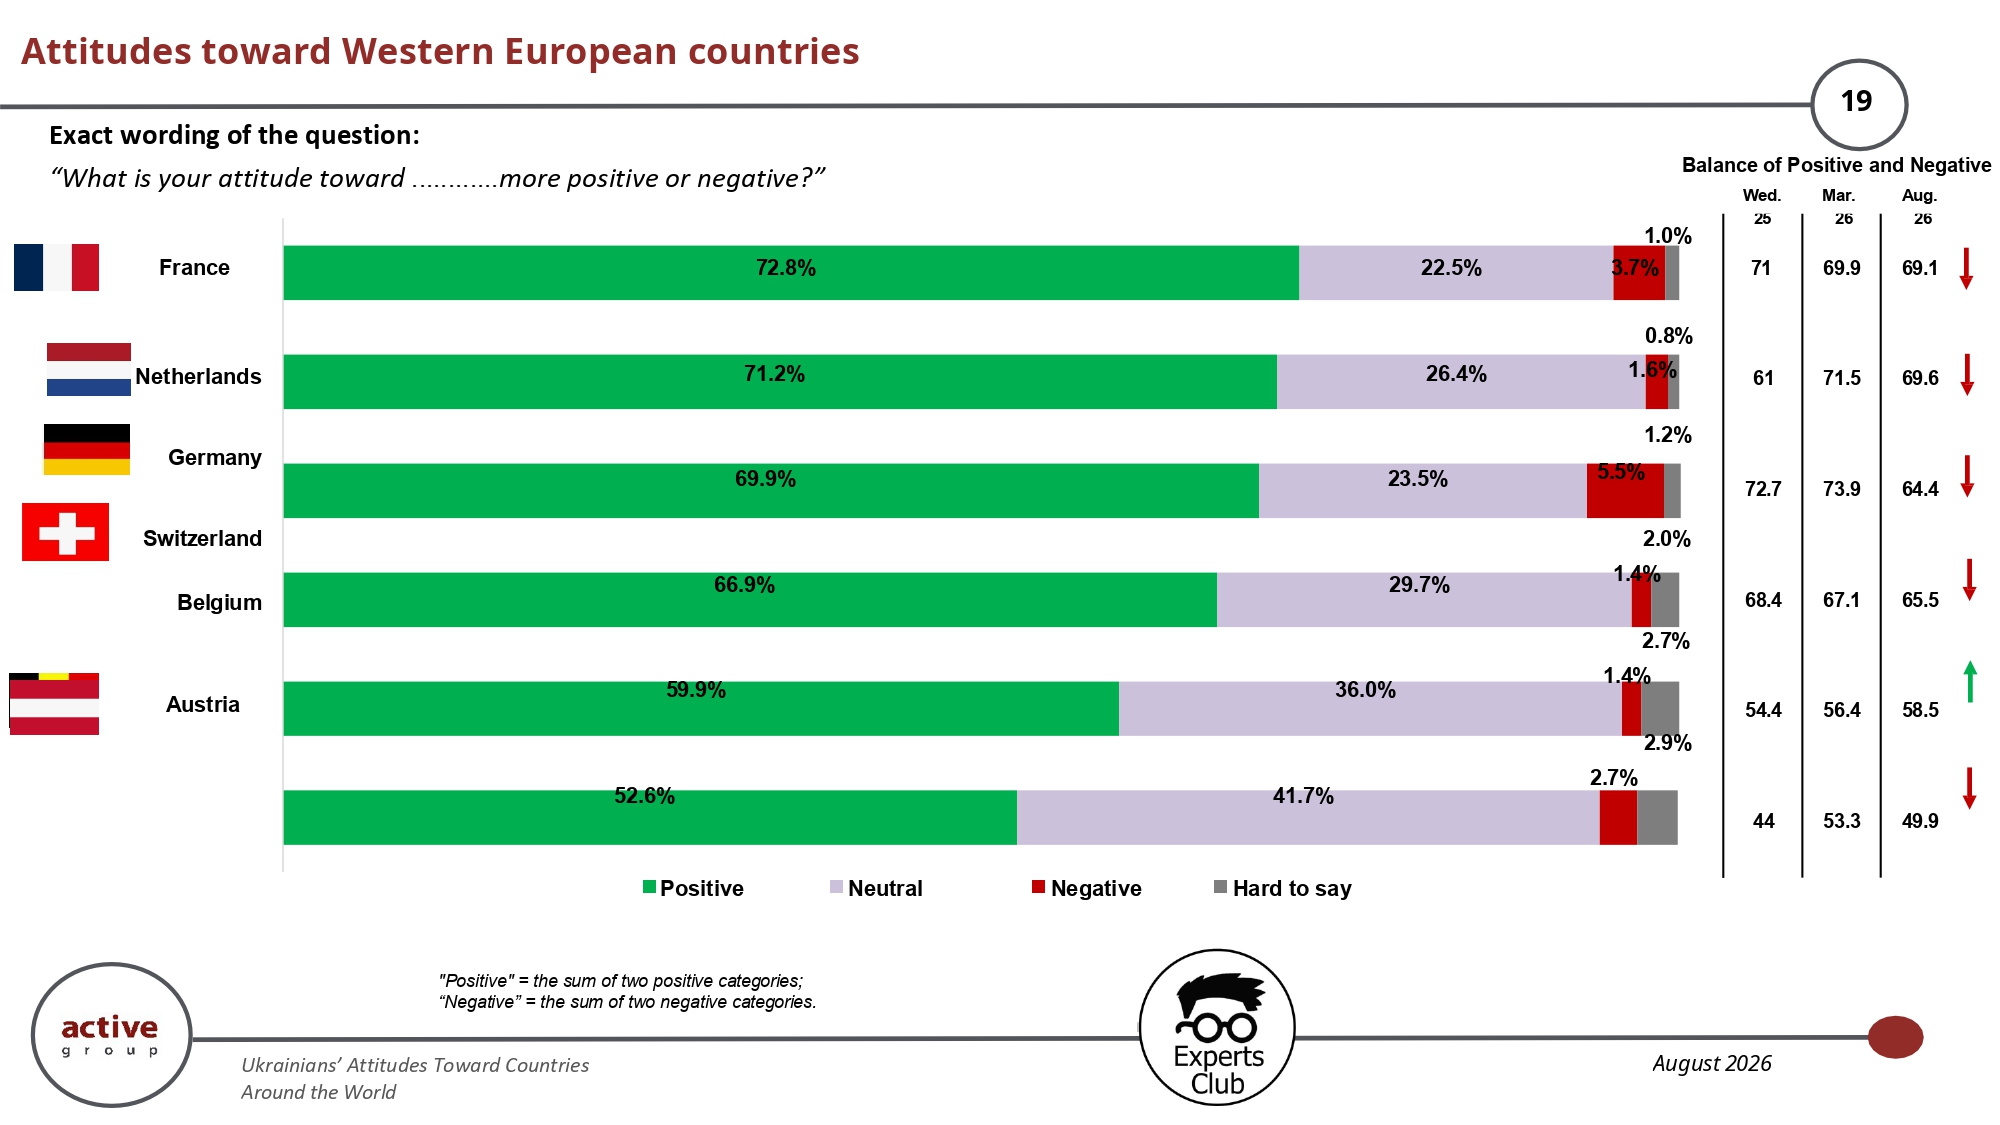
In Western Europe, France and the Netherlands currently receive the highest positive assessments, at 72.8% and 71.2%, respectively, followed by Germany at 69.9%. Positive attitudes toward Switzerland stand at 66.9%, Belgium at 59.9%, and Austria at 52.6%. In all six countries, the balance remains firmly positive, although the dynamics differ from country to country. The most notable feature of the group is that even in countries with lower levels of positive assessments, the main alternative is a neutral rather than a negative attitude.
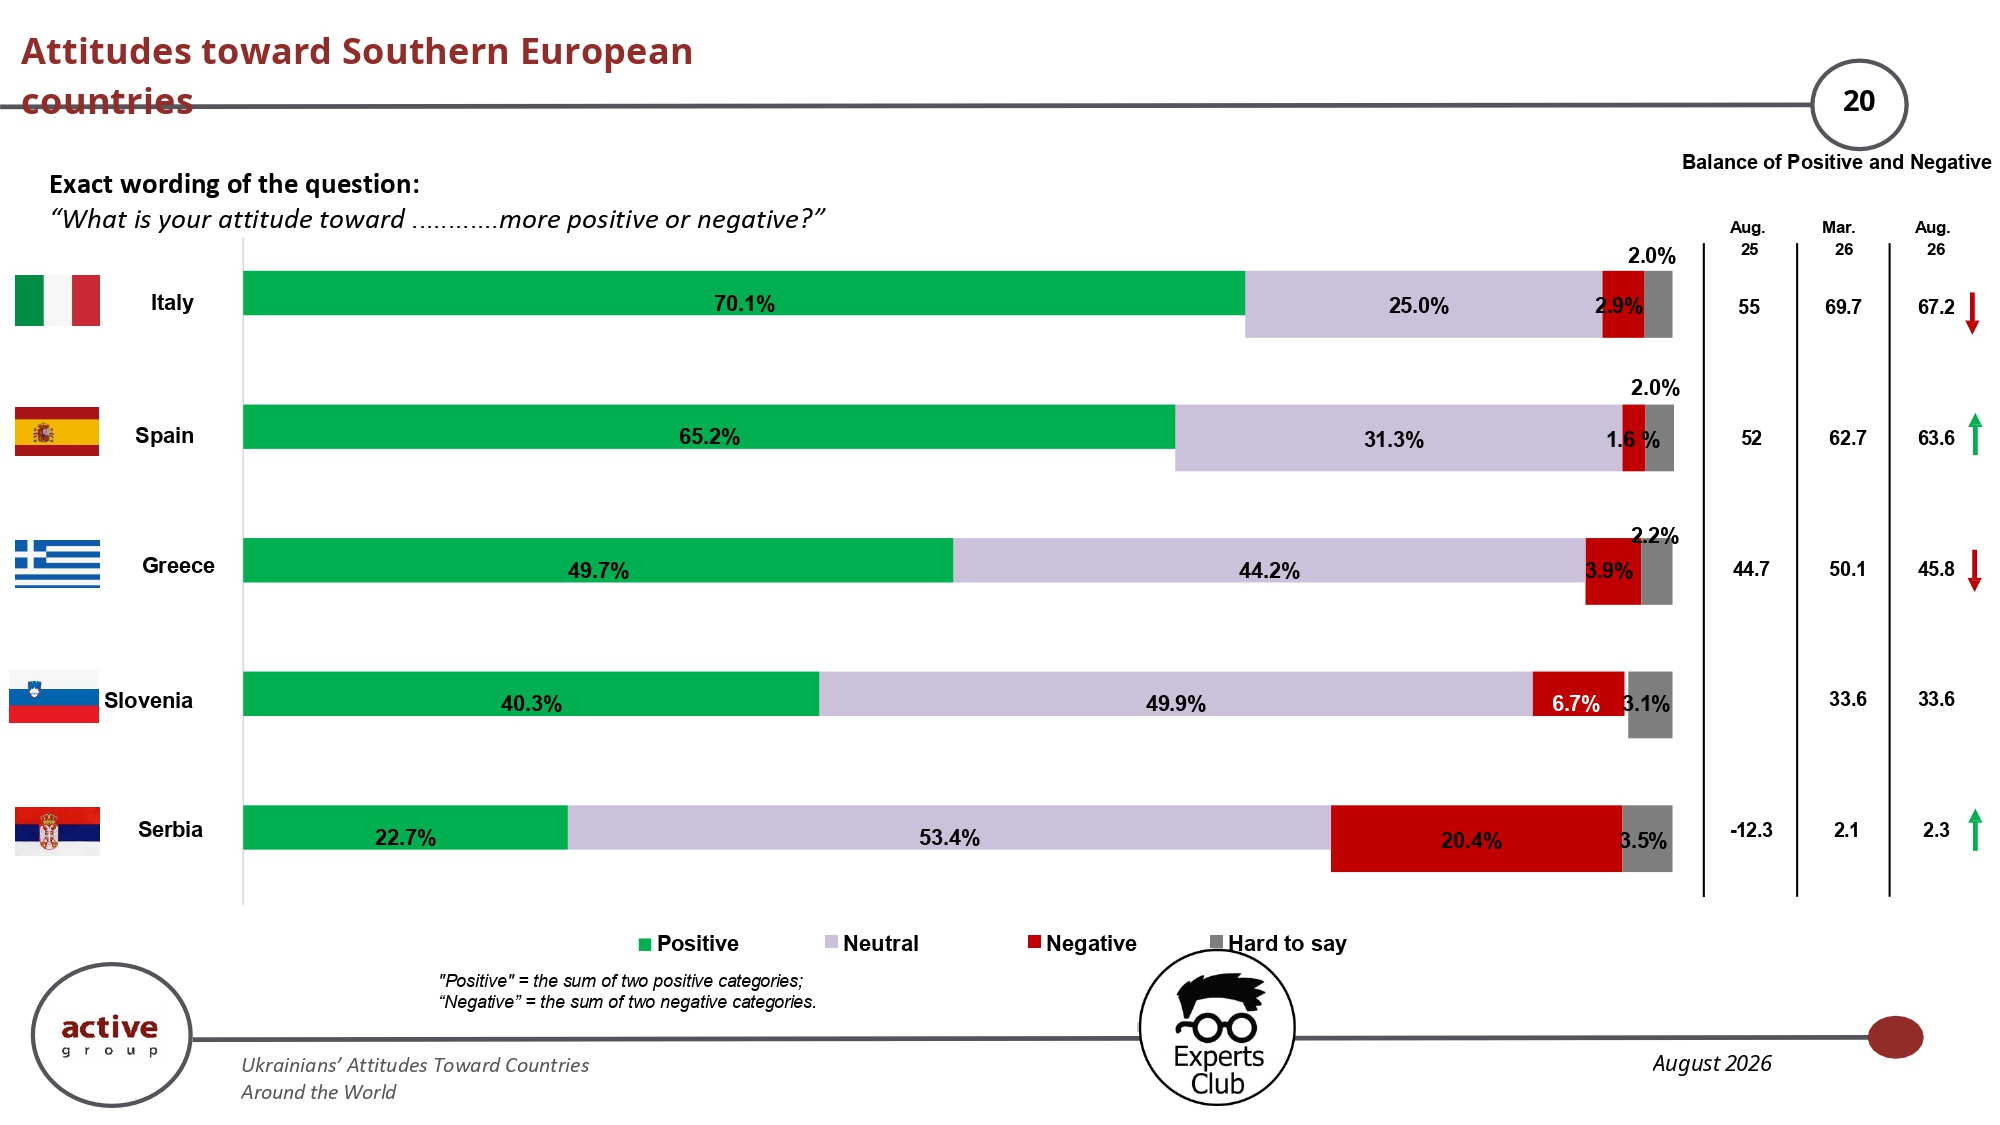
Among Southern European countries, Ukrainians have the most positive attitudes toward Italy and Spain: positive assessments stand at 70.1% and 65.2%, respectively. Greece is approximately in the middle, with 49.7% positive assessments, while Slovenia’s figure is 40.3%. Serbia differs sharply from the other countries in the group: 22.7% have a positive attitude toward it, 20.4% a negative one, while the majority of respondents choose a neutral position. At the same time, the balance regarding Serbia has improved compared with August 2025.
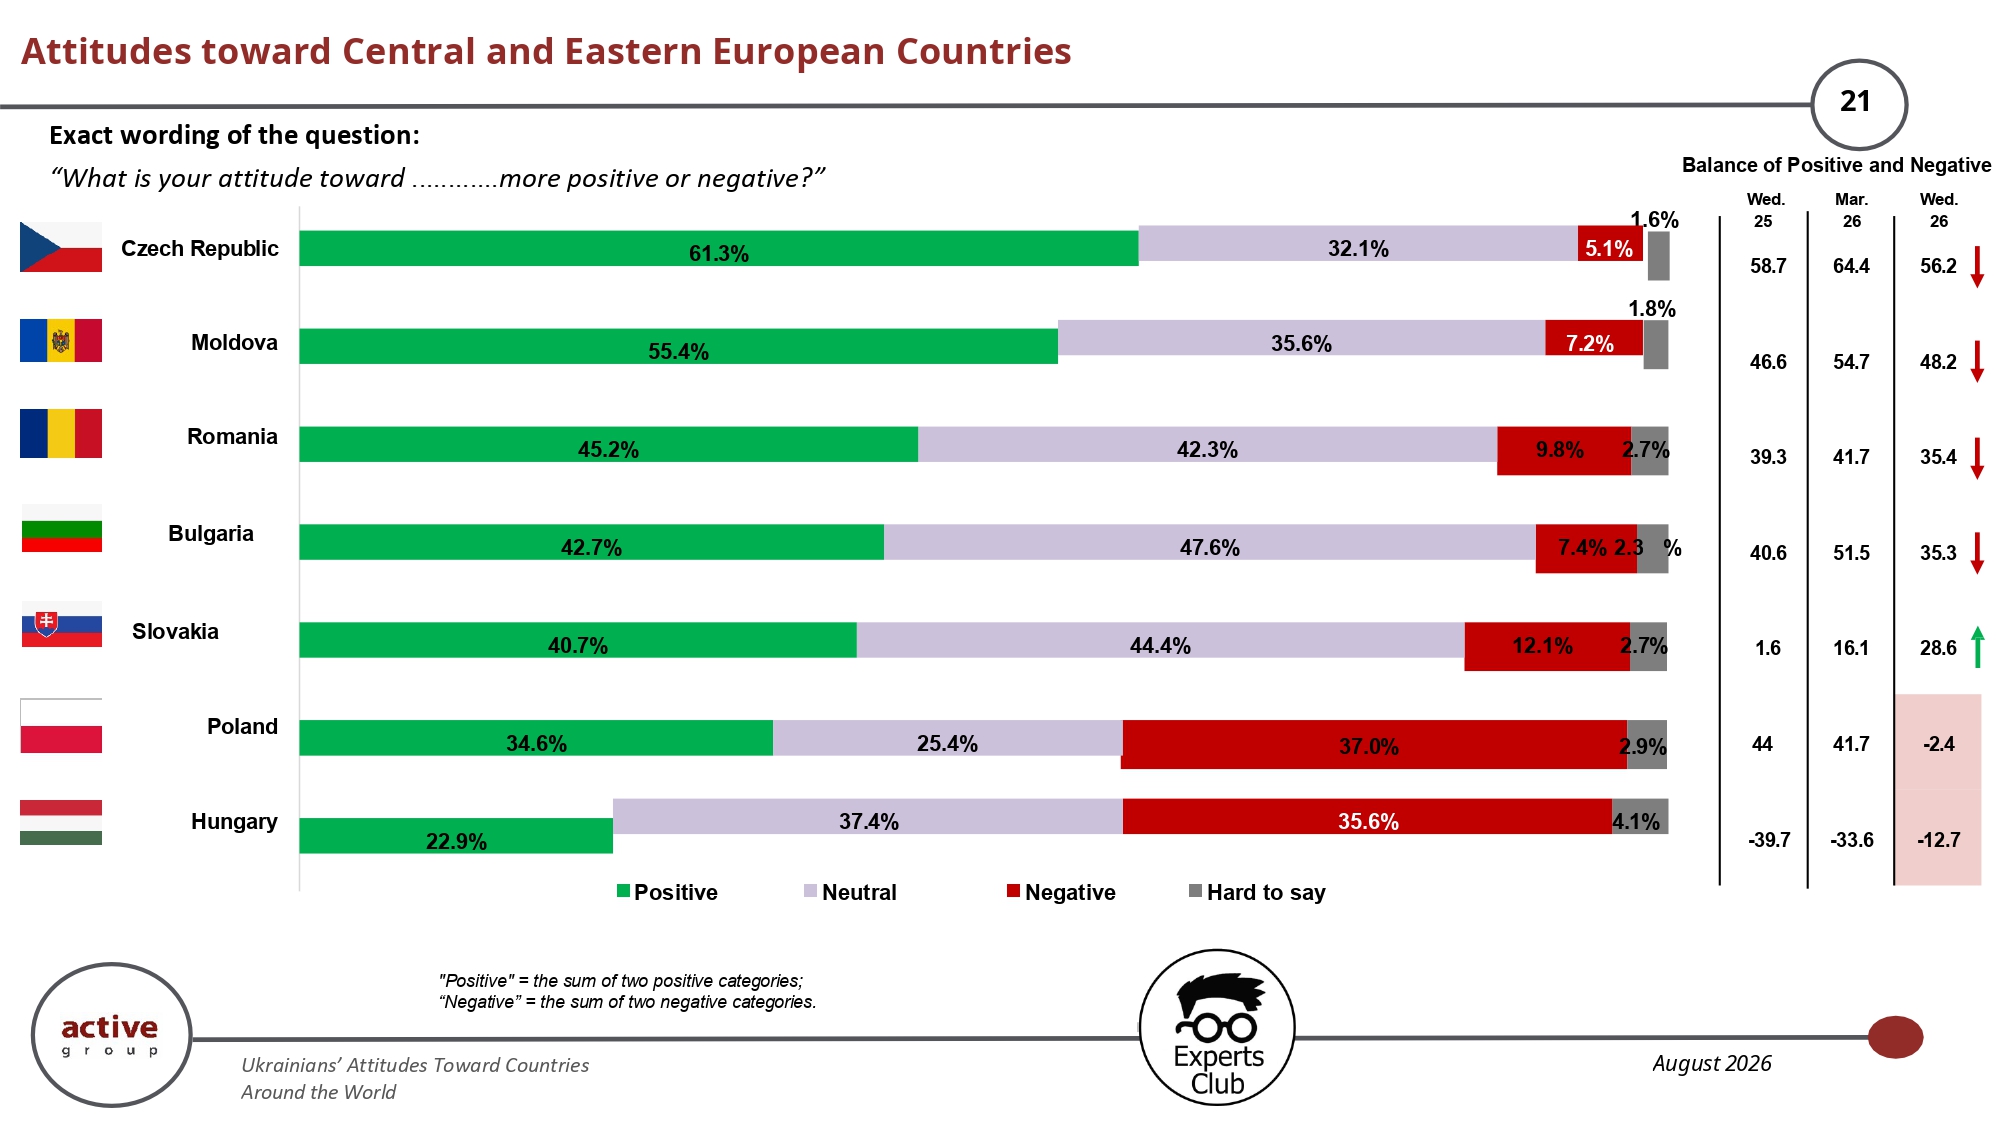
In this group, the Czech Republic has the highest figures: 61.3% of respondents express a positive attitude toward it, while the positive-negative balance is 56.2 points. It is followed by Moldova, Romania, Bulgaria, and Slovakia. Poland, by contrast, shows a sharp change: positive attitudes stand at 34.6%, negative attitudes at 37%, and the balance has moved into negative territory. Hungary also remains in the negative zone, although its balance improved from minus 39.7 in August 2025 to minus 12.7 in August 2026.
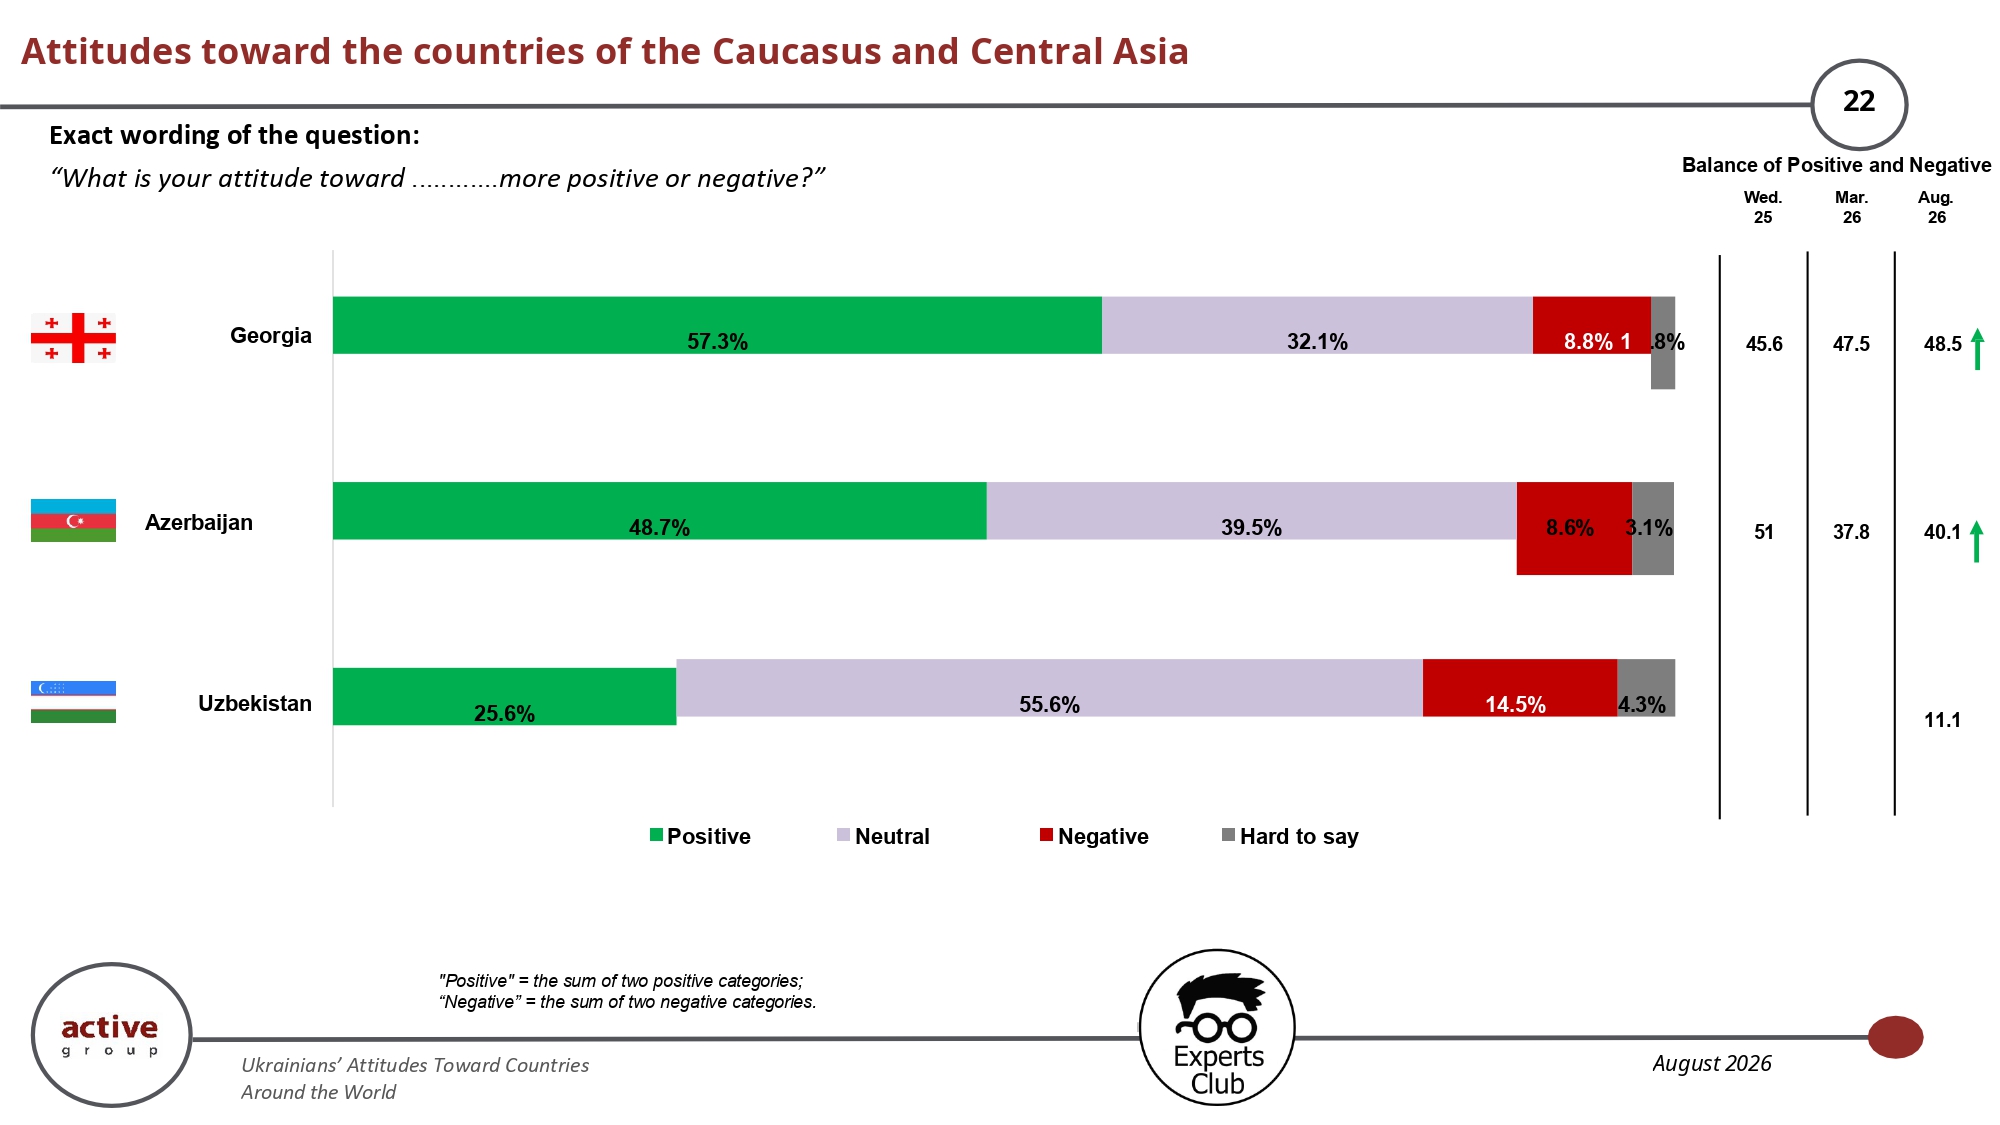
Among the countries presented from the Caucasus and Central Asia, Ukrainians have the most positive attitude toward Georgia: 57.3% of respondents assess it positively, while the balance is 48.5 points. Azerbaijan has 48.7% positive assessments and a balance of 40.1. Uzbekistan lags significantly behind: 25.6% express a positive attitude, while 55.6% take a neutral position. It is precisely the high share of neutral responses that is a characteristic feature of perceptions of countries in this region that are less politically and informationally prominent for Ukrainian society.
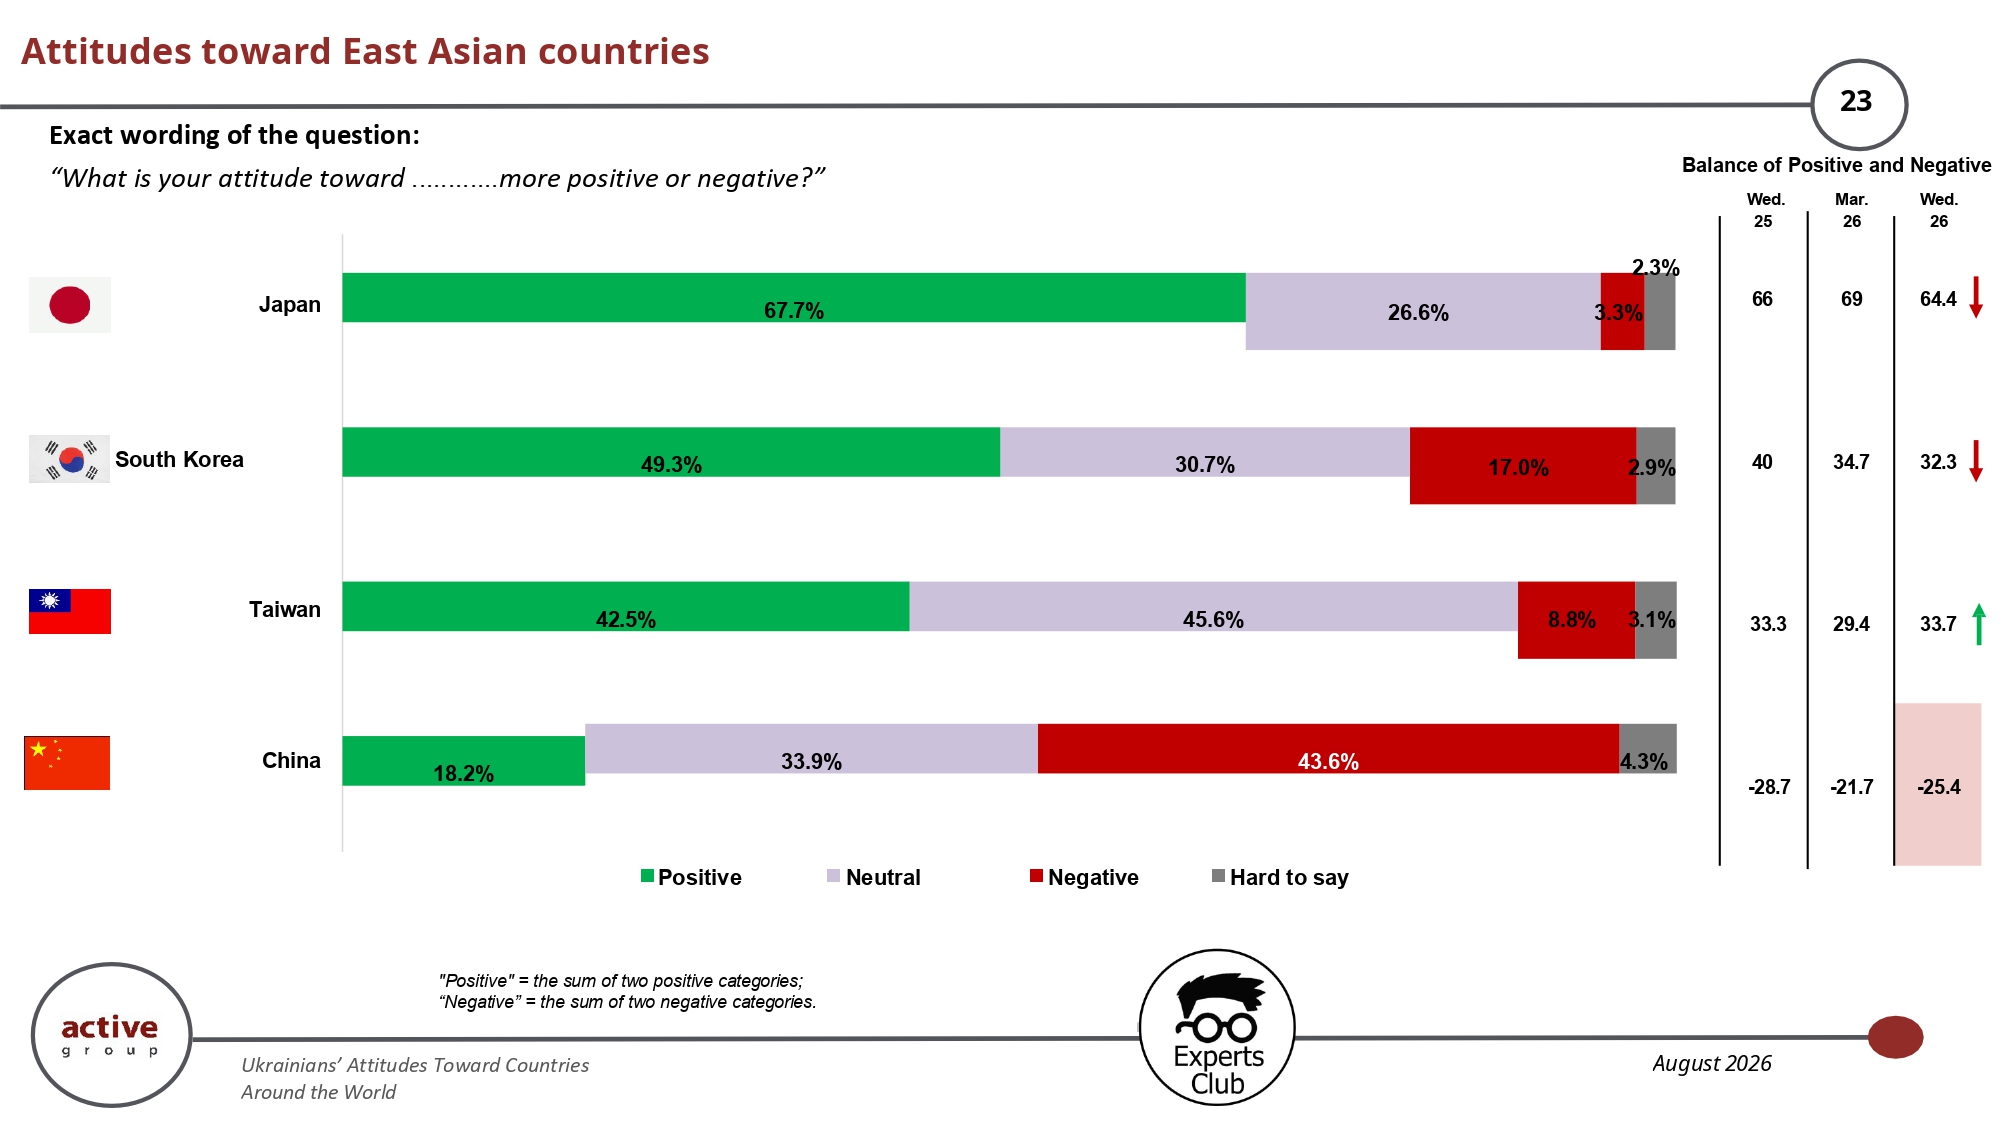
Perceptions of East Asian countries are extremely contrasting. Japan has 67.7% positive assessments and a balance of 64.4 points, South Korea has 49.3% positive assessments, and Taiwan has 42.5%. China, by contrast, receives only 18.2% positive assessments against 43.6% negative ones, producing the lowest balance among all countries studied, at minus 25.4. Thus, Ukrainian public opinion clearly distinguishes between individual Asian countries and does not perceive the region as a homogeneous geopolitical or economic bloc.
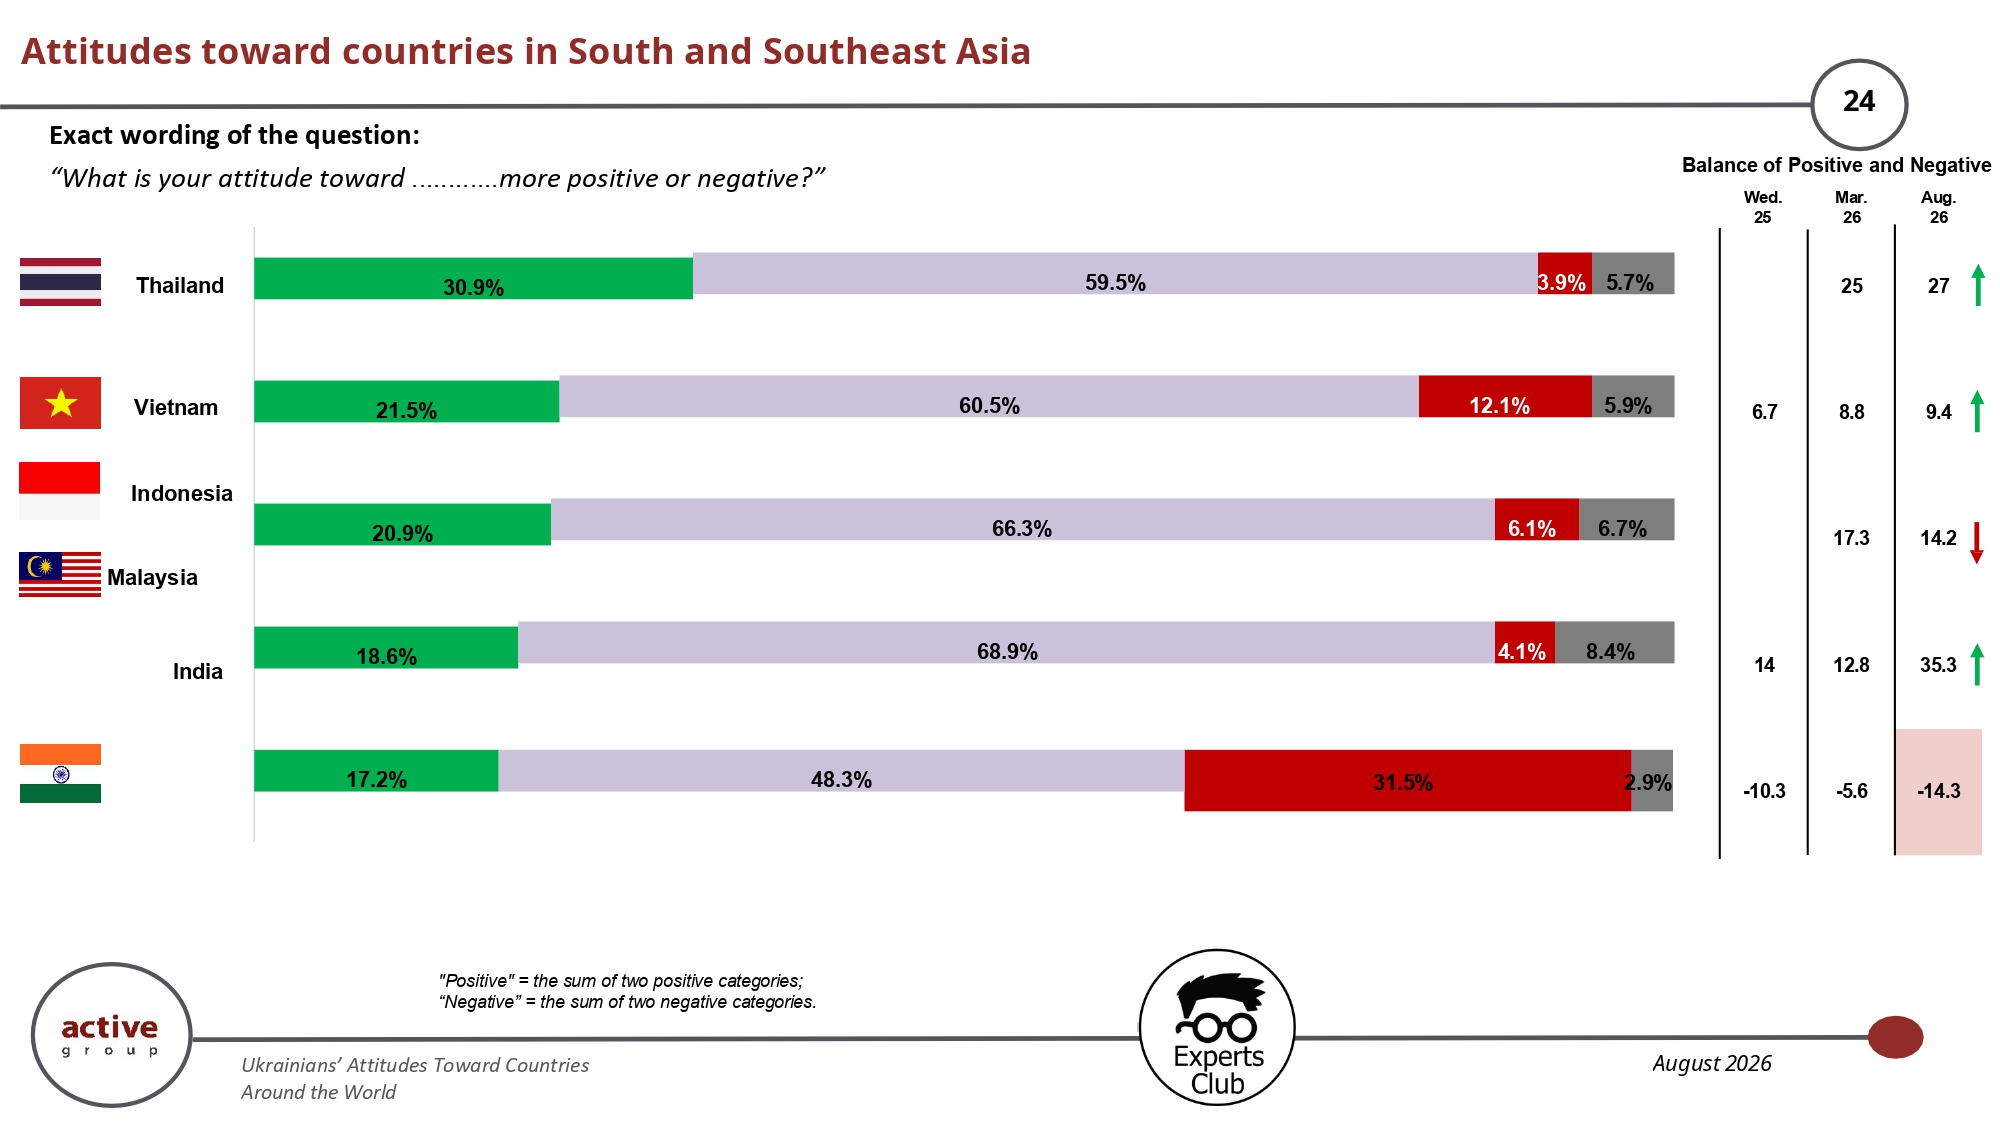
A very high share of neutral attitudes is characteristic of most South and Southeast Asian countries. It is around 60% for Thailand and Vietnam and almost 69% for Malaysia. Positive attitudes range from 18–21% for Malaysia, Indonesia, and Vietnam to 30.9% for Thailand. India stands out with a higher level of negativity: 31.5% assess it negatively against 17.2% positive assessments, resulting in a balance of minus 14.3 points.
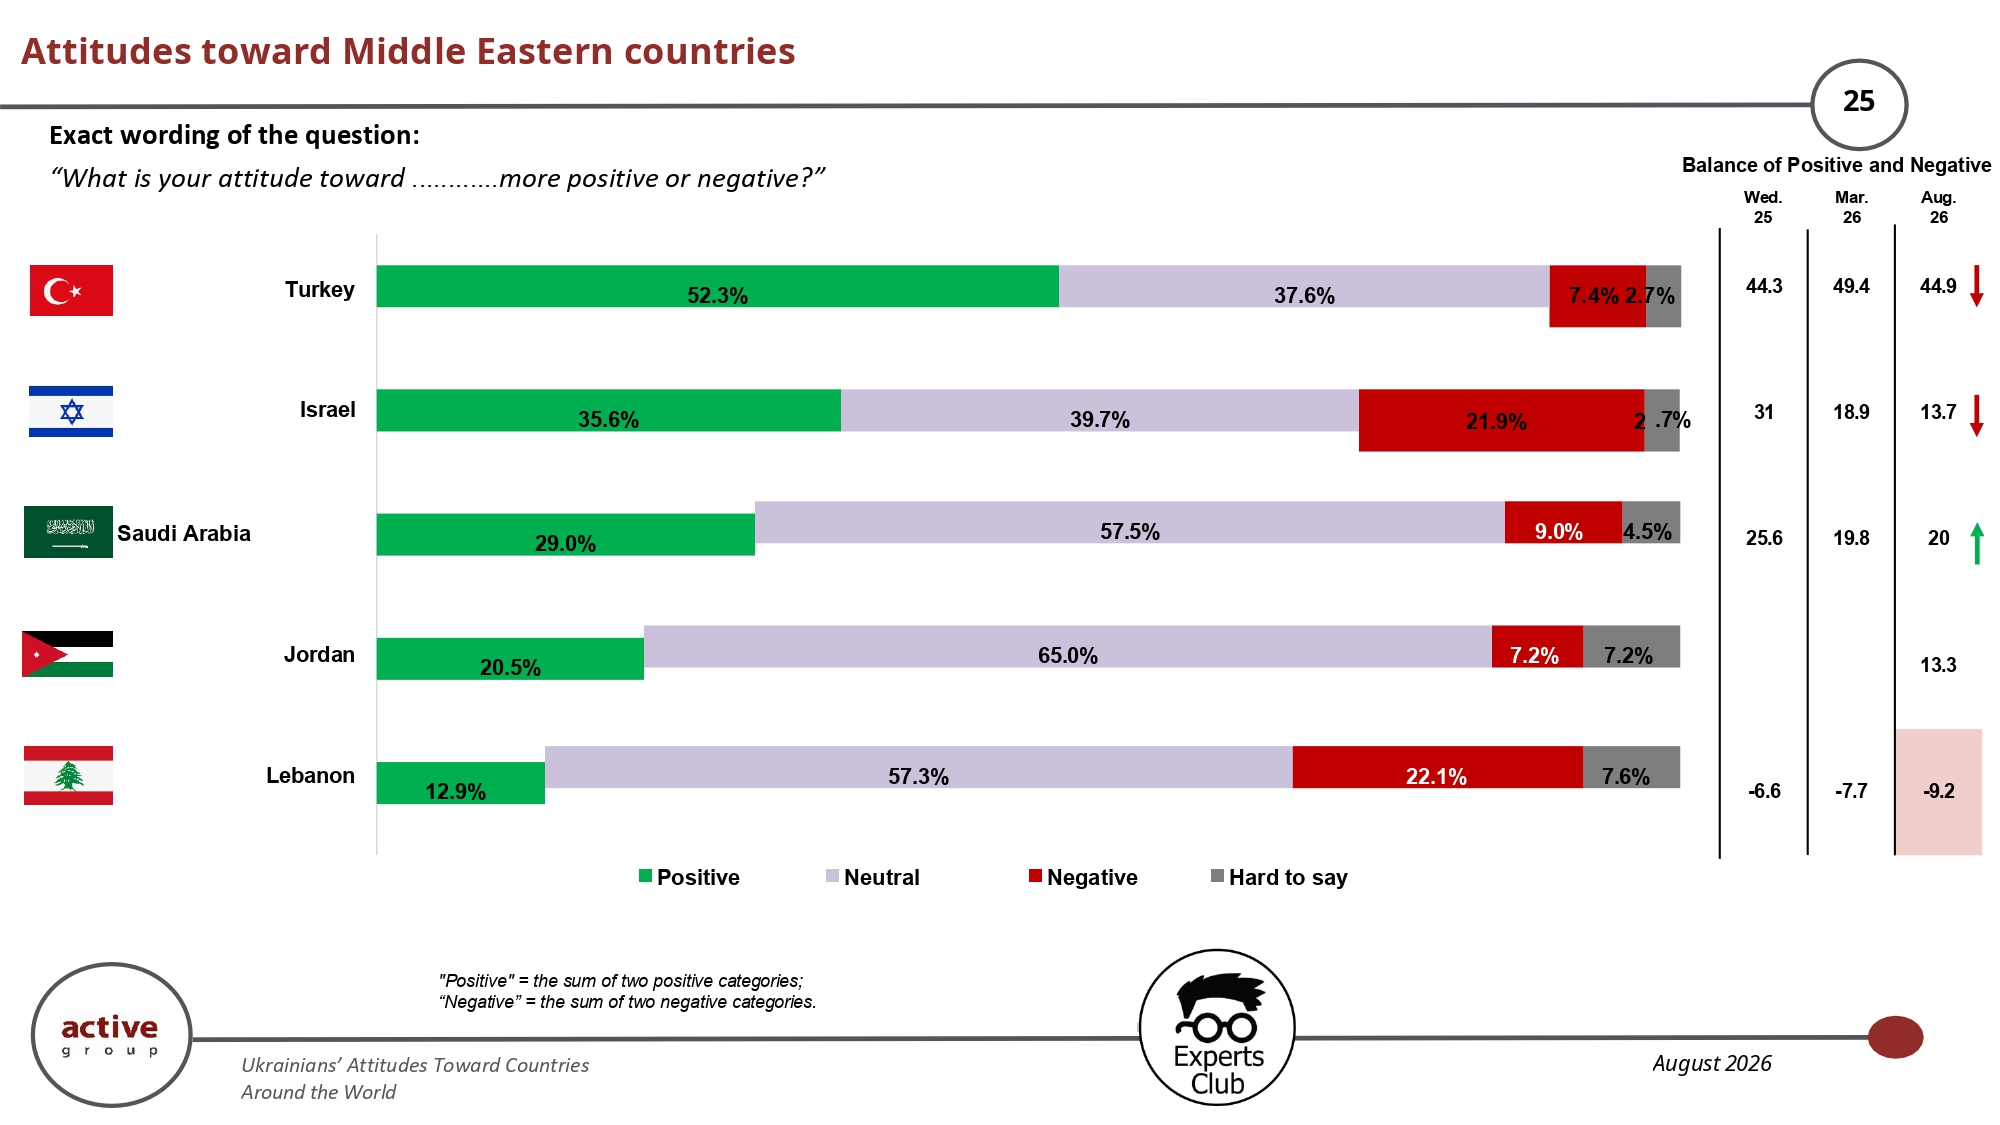
Among Middle Eastern countries, Ukrainians have the most positive attitude toward Türkiye: 52.3% positive assessments and a balance of 44.9 points. For Israel, the positive share is 35.6%, but the balance has been declining over time and stood at 13.7 in August 2026. Saudi Arabia and Jordan are perceived mainly neutrally, while Lebanon is the only country in this group with a negative balance, at minus 9.2. Overall, the region is characterized by a much less clear-cut perception than European countries.
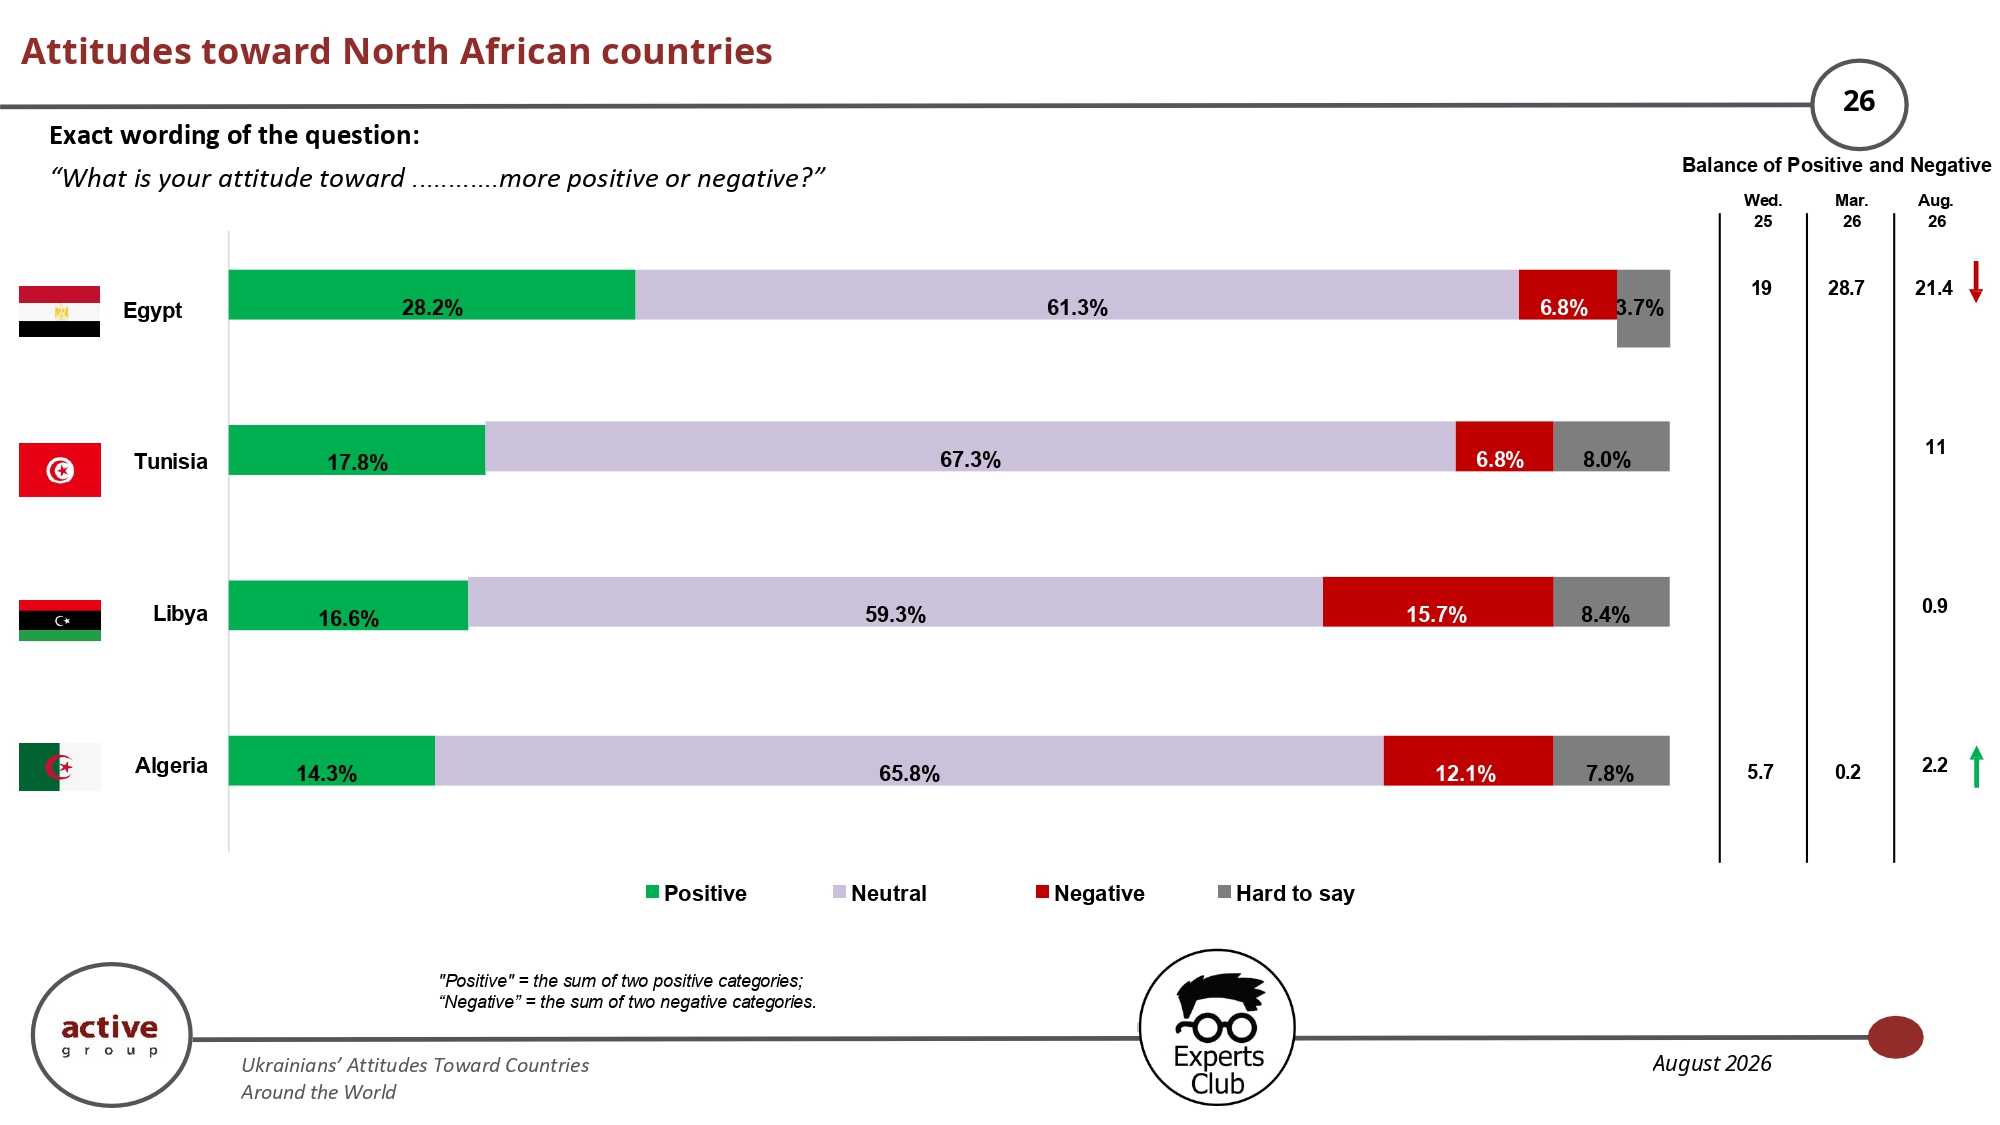
For North African countries, neutral attitudes dominate: their share ranges from approximately 59% to 67%. Egypt has the highest share of positive assessments at 28.2%, while its balance is 21.4 points. Tunisia’s balance is 11, Algeria’s is about 2.2, and Libya’s only 0.9. Thus, there is no generally negative perception of the region, but a strong positive image has been formed primarily only in relation to Egypt.
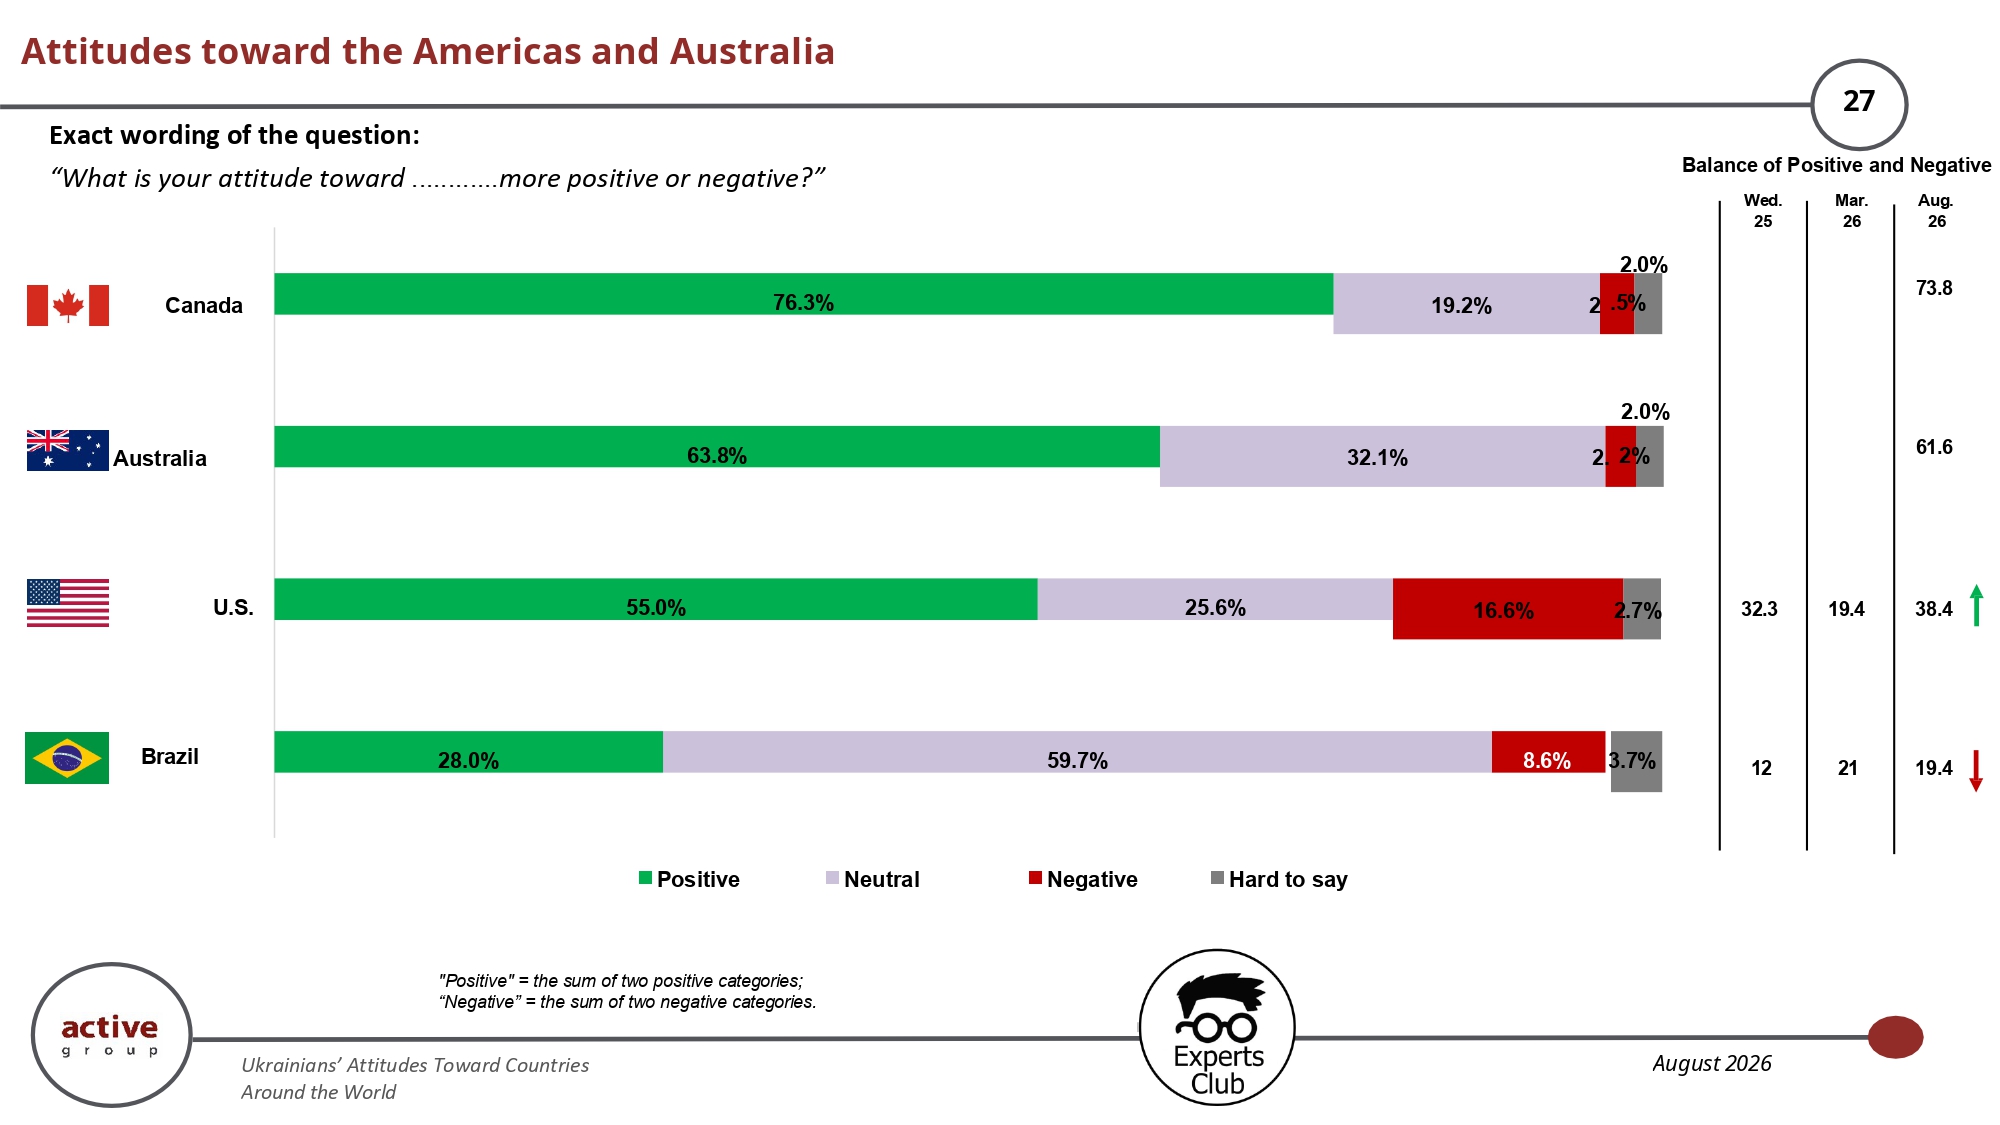
Canada has the best result not only within its regional group but among all the countries studied: 76.3% of Ukrainians have a positive attitude toward it, while the balance reaches 73.8 points. Australia also has very high figures — 63.8% positive assessments and a balance of 61.6. Positive attitudes toward the United States stand at 55%, while the balance increased to 38.4 compared with 19.4 in March 2026. Brazil is perceived much more neutrally: 59.7% of respondents take a neutral position and only 28% a positive one.
The combined results of the study demonstrate a significant gap between Ukraine’s economic geography and the geography of public sympathies. China is the country’s largest trading partner but at the same time has the lowest attitude balance, while Canada and the countries of Northern and Western Europe occupy the upper part of the public favor ranking. The deterioration in attitudes toward Poland against the backdrop of its extremely important role in Ukraine’s foreign trade is another noteworthy signal. For governments, businesses, and diplomatic missions, these data show that economic interdependence in itself does not guarantee a positive public image, while reputational capital may differ substantially from a country’s actual weight in trade. The presentation was prepared on the basis of the study of Ukrainians’ attitudes toward countries around the world conducted in August 2026.